Trading Tools
Learn about specialized tools traders may use to make trading decisions.

After-Hours Trading: What It Is, How It Works
What is after-hours trading? How does it work? Learn about the rules, risks, and benefits of extended-hours trading.
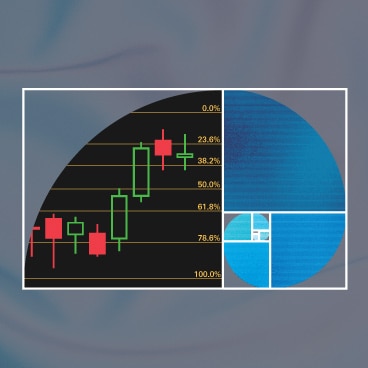
Fibonacci Retracement and Extension Levels Explained
Fibonacci retracement and extension levels are technical analysis tools that can help traders identify potential support and resistance price levels in stock trading.

4 Reasons to Try Paper Trading
Paper trading isn't only for beginners. Here are four reasons you might benefit from a simulated trading experience.

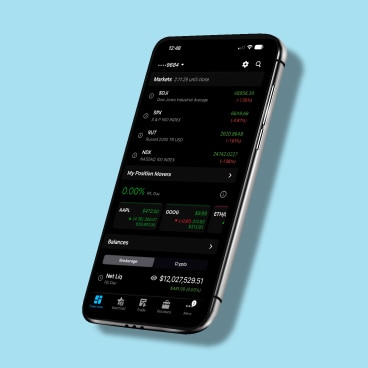
Introduction to thinkorswim® mobile for iPhone
Learn how to navigate and place trades on the thinkorswim® mobile app for iPhone.
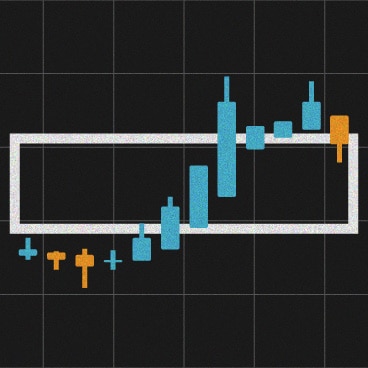
How to Use Heikin Ashi Charts
Heikin ashi charts can potentially help traders identify when trends are likely to reverse. Learn how to read these charts and how to use them when trading.
3 Stock Options Trading Stats on thinkorswim
Learn how three options statistics on thinkorswim—implied and historical volatility, the Sizzle Index, and the put/call ratio—can help traders make more informed decisions.
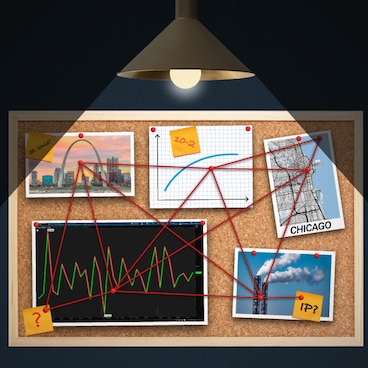
Tracking Lesser-Known Economic Indicators
Researching lesser-known economic indicators on the thinkorswim® platform is a low-effort way to potentially elevate an investor's game.

Using Options Volatility Data to Research Moves
These options sentiment indicators—available on the thinkorswim platform—enable a trader to see the market's expectations for a security's potential move

Margin Loans and Purchased Money Market Funds
Money market funds aren't the same as cash when it comes to margin loans. Understanding the key differences can help avoid surprise margin loans and interest charges.