How to Use Heikin Ashi Charts
Solely relying on news headlines, social media sentiment, or even fundamentals like earnings to help identify the end of a trend in a stock might not be the best strategy for traders. Instead, it can make sense to use every tool available—including technical analysis—to provide an objective perspective on when a trend might be changing.
While there's no foolproof method to identify a trend change, one technique that can potentially provide information is the heikin ashi (sometimes spelled heiken ashi) charting technique.
What is a heikin ashi chart?
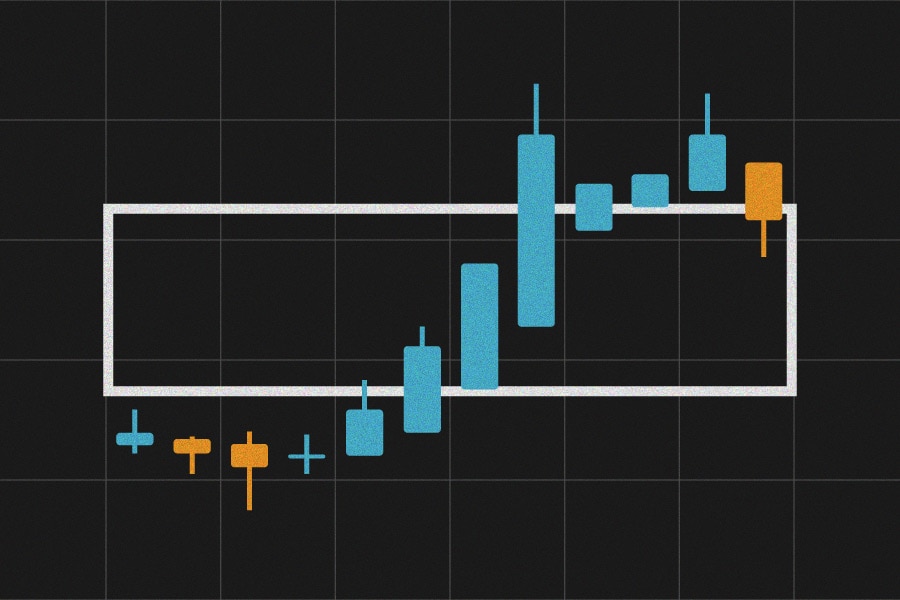
A heikin ashi (or "average bar") chart is a modified form of the common candlestick chart. Created in the 1700s by a Japanese rice trader, heikin ashi charts combine price data from current and previous price bars (also called candlesticks) to filter out small price fluctuations, providing a smoother visualization that may make spotting trends easier. While heikin ashi charts are constructed in a similar way to regular candlestick charts, they don't have price gaps, and they use different formulas to derive their close, open, high, and low prices.
For a heikin ashi bar:
- The closing price is the average price of the current bar, or the actual close, open, high, and low prices divided by four.
- The opening price is the midpoint of the previous bar, or the actual open price of the previous bar and the actual close price of the previous bar divided by two.
- The high price is the highest value among the actual high price of the current bar and the open of the current heikin ashi bar.
- The low price is the lowest value among the actual low price of the current bar and the open of the current heikin ashi bar.
On the thinkorswim® platform, traders can easily pull up a heikin ashi chart on the Charts tab. Simply type in a ticker to bring up a chart, then select Style and change the Chart type from Candle to Heikin Ashi. Pictured below is a side-by-side comparison of a heikin ashi chart (on the left) and a regular candlestick chart (on the right). The heikin ashi chart appears smoother than the candlestick chart because there are no price gaps. It also features fewer shifts between strings of red and green bars due to the way it's constructed.
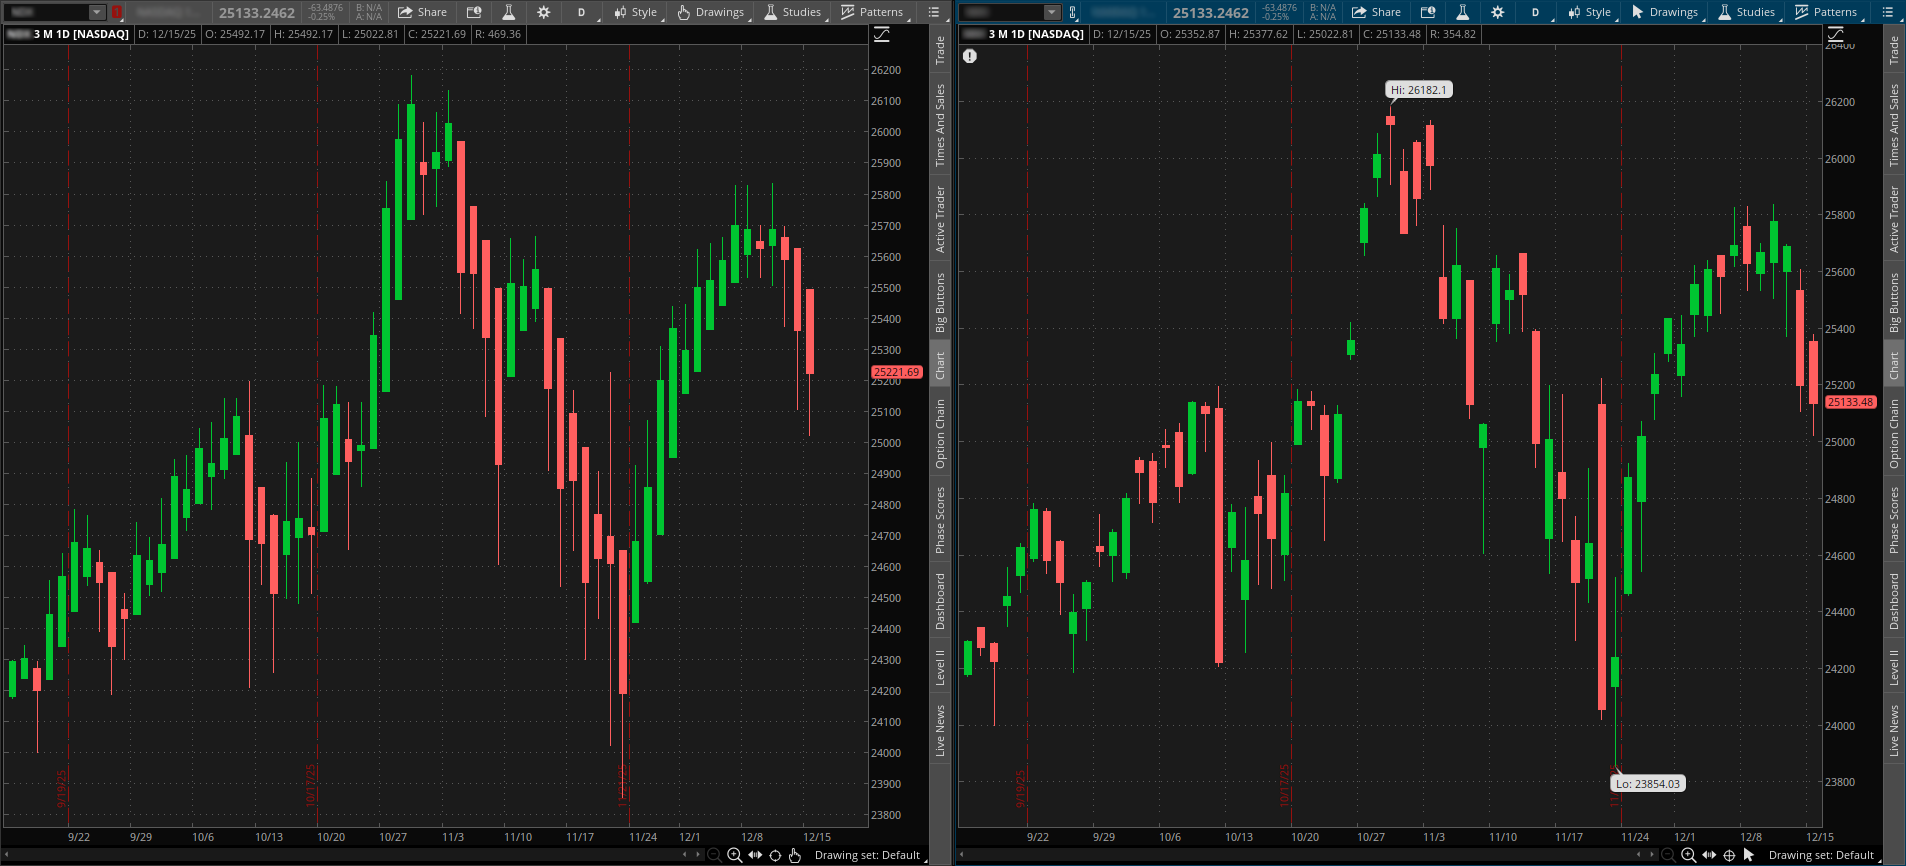
Source: thinkorswim platform
For illustrative purposes only.
Putting heikin ashi to work
Heikin ashi charts can be used to identify potential trends or trend reversals. One reason traders use this chart type is that it takes into context average price data from multiple price bars instead of only current price data. This means a group of consecutive red or green bars might be able to help confirm an ongoing trend or signal a potential trend reversal—a rotation from a bullish bias to a bearish bias or vice versa. Changes from long-range candles (candles with large bodies) to short-range ones (candles with short bodies) that have wicks or tails on both sides can also potentially indicate uncertainty or indecision among market participants, which may occur during a trend's turning point.
Like with any charting technique, however, a single red or green bar in a string of bars featuring the opposite color can be an anomaly. Here are a few other points traders should consider before using heikin ashi charts:
- The current price of a heikin ashi bar may not match the actual trading price because heikin ashi bars are constructed using average prices.
- Trading signals may appear later than they would on a normal candlestick chart in heikin ashi charts.
- Heikin ashi charts tend to be most effective in strong, trending markets, rather than volatile ones.
- Heikin ashi bars typically remain red during downtrends and green during uptrends, unlike regular candlestick charts.
Let's walk through an example of how a trader might use a heikin ashi chart in conjunction with other technical analysis tools.
In the chart below, the group of long green bars moving up in the middle of the chart indicates an uptrend, whereas the group of long red bars moving down after that indicates a downtrend. However, there is no guarantee trends will continue, and finding turning points can be a challenge. Thankfully, heikin ashi charts can potentially help.
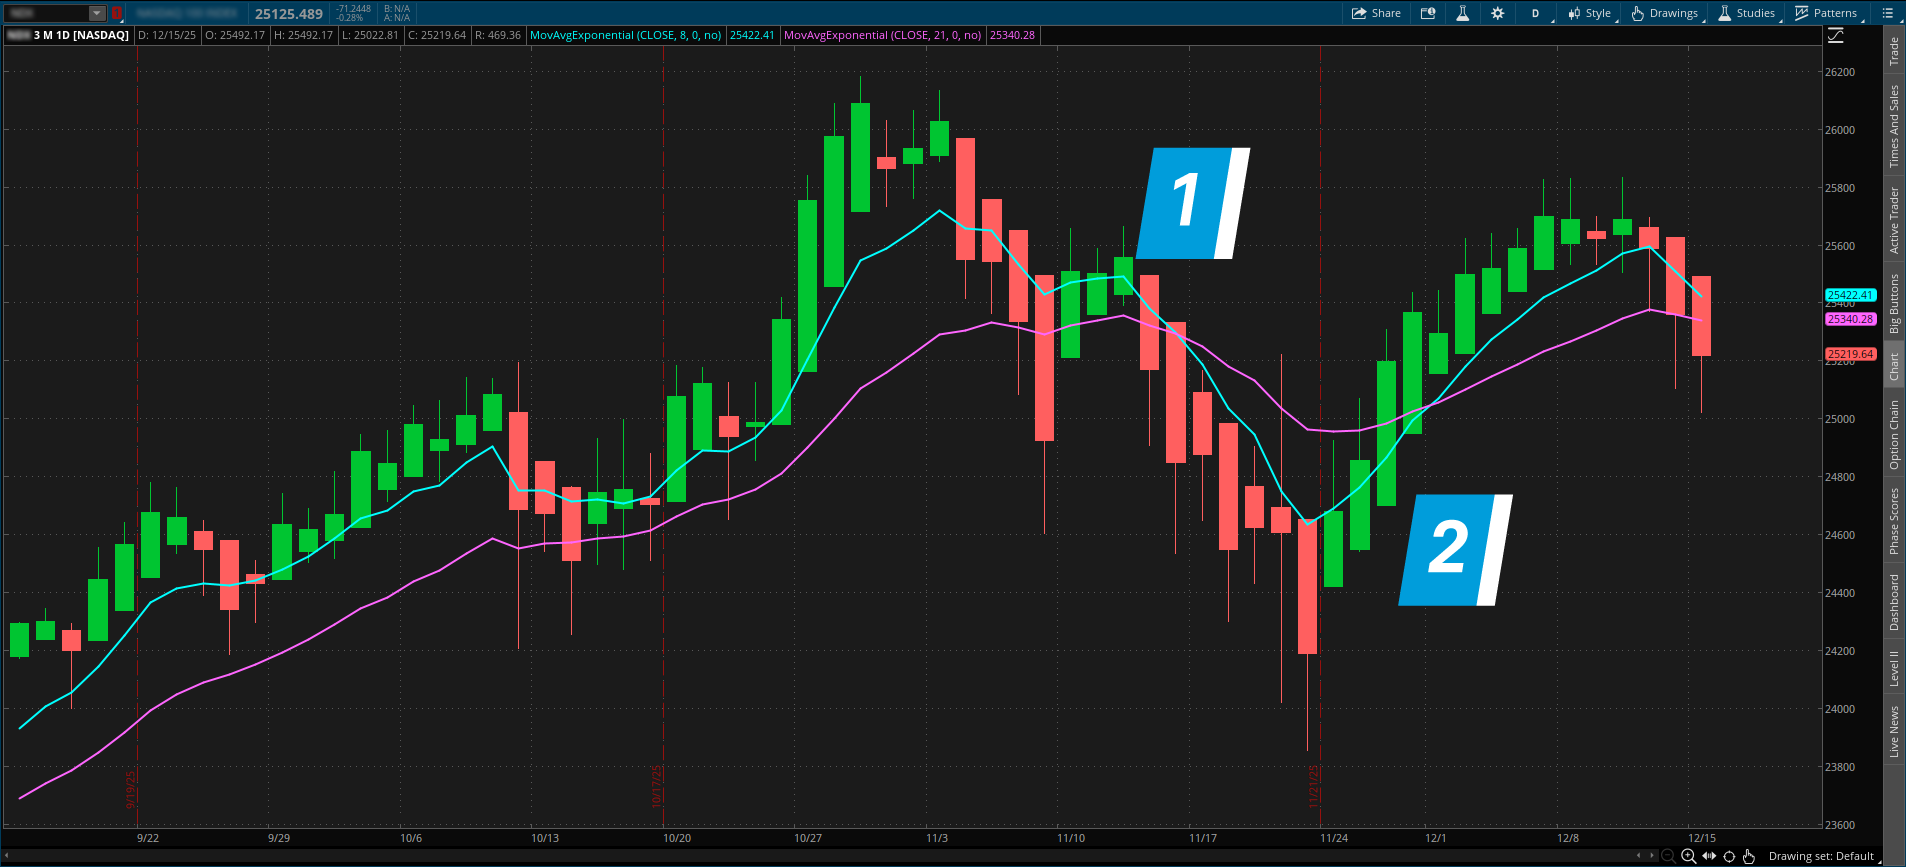
Source: thinkorswim platform
For illustrative purposes only. Past performance does not guarantee future results.
At point #1 in the chart above, for example, two green bars developed without bottom wicks, followed by a short-range green bar with a bottom wick, creating a choppy uptrend. As previously mentioned, when short-range bars with wicks follow a series of bars of the same color without wicks, it can indicate a trend reversal is potentially about to begin. And that's exactly what we see in this case. After the short-range green bar with a wick appeared, a series of red bars followed as the security fell.
Using heikin ashi charts with other studies in a trade
To take the above analysis further, traders can add moving average studies to their heikin ashi chart. One way to do this is to apply two exponential moving averages (EMAs) to help potentially identify trends or trend reversals. In the image above, there's an eight-period (blue line) and 21-period (purple line) EMA overlaid on the chart.
At point #1, as previously discussed, there's a choppy trend up, which could have been viewed by an observant trader as a signal of an impending trend reversal. This was then followed by a couple of long-range red bars as the security began to fall. While these long-range red bars were developing, the eight-period EMA started to move sharply lower. This could have raised a red flag that a heikin ashi reversal was potentially taking place. If a trader had a long position open, it might have been a good time for them to think about where to place a stop order. After that, the eight-period EMA crossed the 21-period EMA. This is often considered a strong bearish signal, and in this case, it did confirm a short-term downtrend because the security continued to fall for some time.
Conversely, at point #2, it looks like a new uptrend might be starting. After a group of short-range red bars and a single long-range red bar formed, the eight-period EMA began to rise, and a group of green bars started forming. Not long after that, the eight-period EMA crossed above the 21-period EMA. This is often considered a bullish signal, and once again, as one might suspect, the security then continued to rise for some time.
By combining a heikin ashi chart and moving averages, a trader may have been able to position around the trends seen in the chart above, potentially enabling them to turn a profit.
Bottom line
While technical analysis cannot predict or guarantee the future performance of any security or strategy, heikin ashi charts might be able to help traders identify trends that may be forming, particularly when used in conjunction with other technical analysis tools. But it's important to remember that markets are unpredictable, and indicators cannot guarantee a trend will continue or reverse. These tools should be used as just one weapon in a trader's arsenal.
Want to learn more about how to trade using heikin ashi charts? Check out Schwab's Trader Talks coaching webcasts.