What Is a Market Bubble?

Key takeaways
- Market bubbles usually feature soaring prices, stretched valuations, speculative excess, and claims that new technology will bring a new era of profitability.
- Extreme price gains can raise the risk of a crash, particularly when accompanied by accelerating gains, high volatility, and heavy stock issuance, but many such moves never collapse.
- Even when asset prices appear irrationally high, bubble peaks are nearly impossible to identify as they occur.
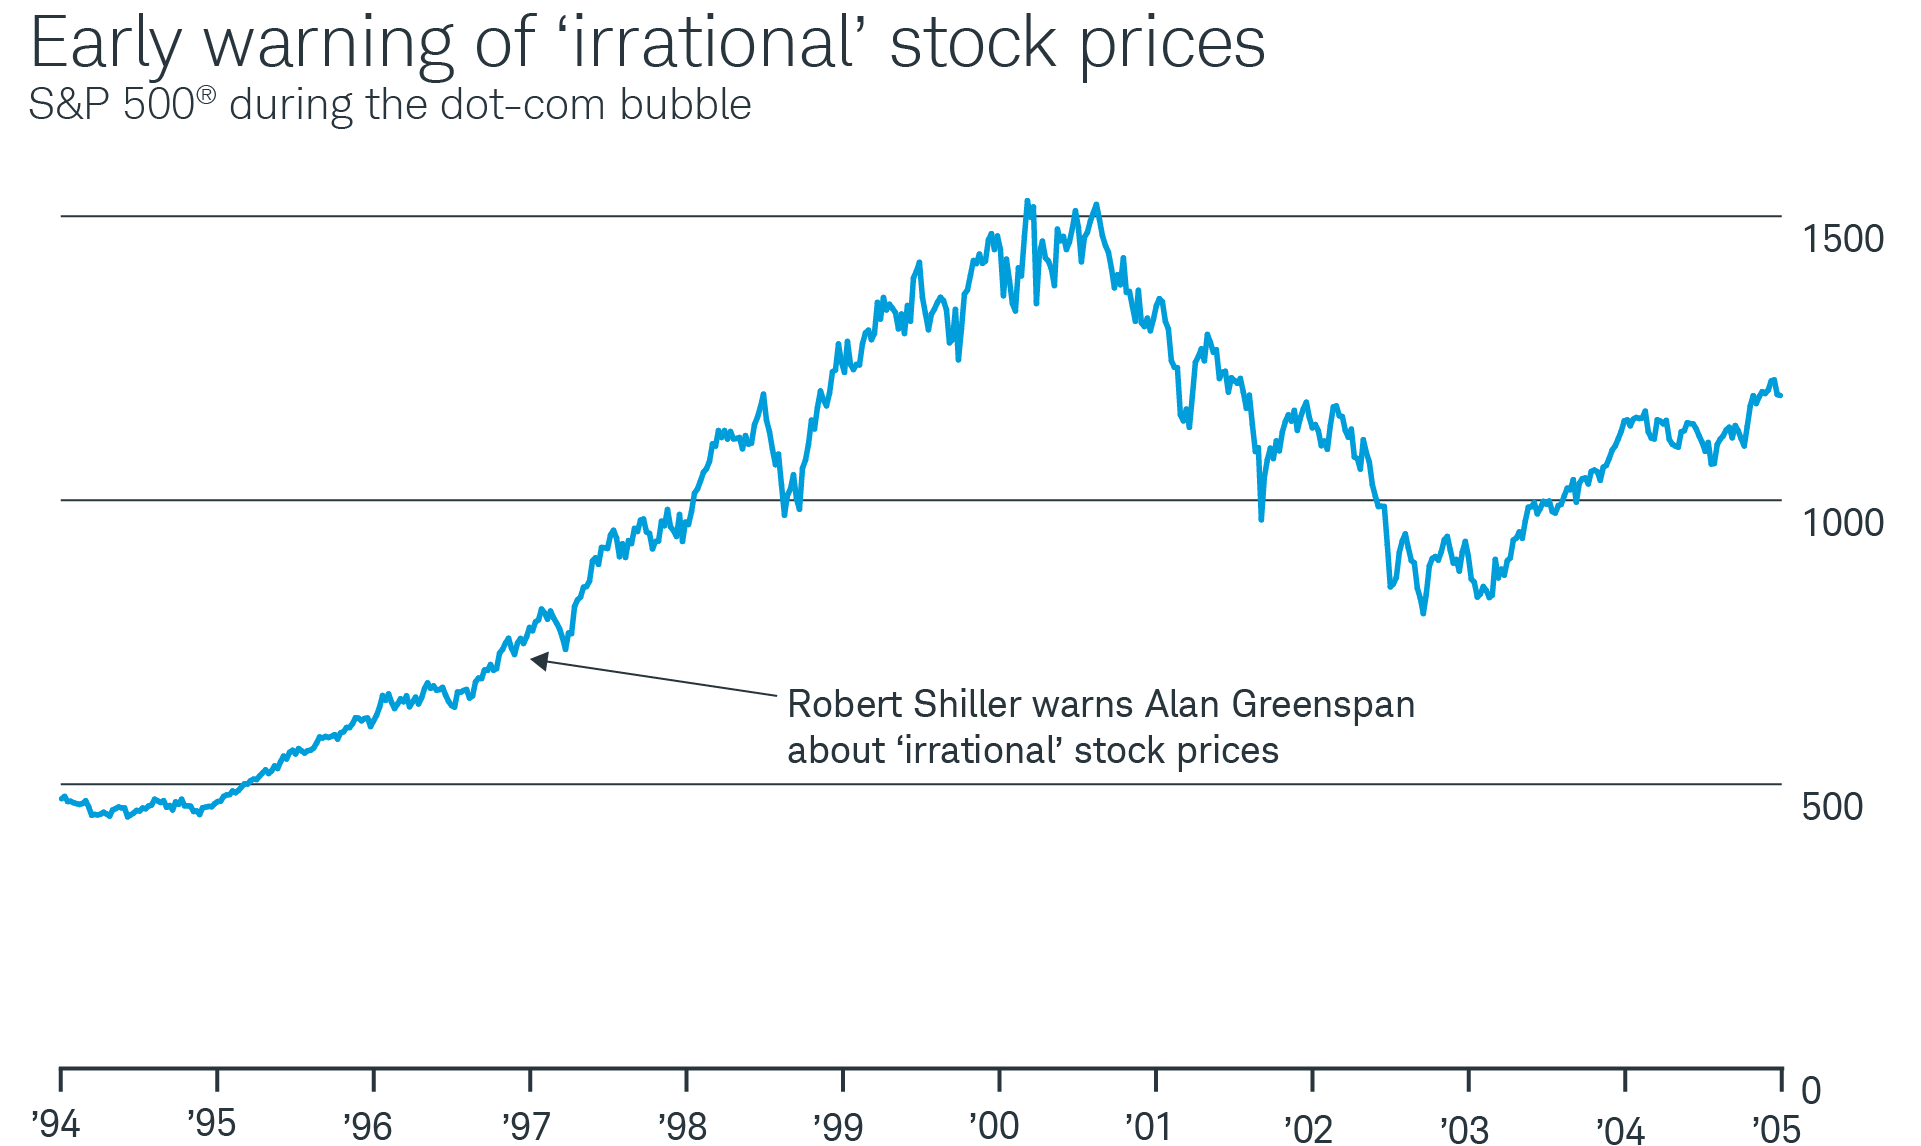
In December 1996, Nobel Prize-winning economist Robert Shiller warned then-Federal Reserve Chair Alan Greenspan over lunch that stock prices were "irrationally" high. Two days later, Greenspan used the now-famous phrase "irrational exuberance."
Shiller is widely credited with spotting the dot-com bubble long before it burst. But what good would that insight have done him or any investor? The S&P 500® Index roughly doubled in the three-plus years after Shiller's warning. Then it lost nearly half its value. But even at the bottom of that long bear market, the index remained above where it had been on the day of Shiller's lunch with Greenspan.
Recognizing the classic signs of a bubble isn't that difficult, especially the longer it inflates. But it's impossible to predict how big one might get or when it might burst. Still, investors should be aware of the growing risks and perhaps take steps to minimize the potential impact.
Data source: S&P Dow Jones Indices
For illustrative purposes only. Past performance is no guarantee of future results.
Characteristics of famous market bubbles
There are no universally accepted criteria for identifying bubbles. But broader U.S. stock market bubbles have shown similar characteristics: high and rapidly rising prices that stretch valuations to extremes, fueled at least partly by speculative excess; rhetoric about a new era of productivity and profitability, usually due to groundbreaking technological advances; and a bust in which prices collapse.
Extreme valuations: Massive price gains that stretch valuations well beyond average levels are probably the most commonly cited evidence of a bubble, while a bubble is still forming and often after the fact. In March 2000, at the peak of the dot-com bubble, the S&P 500 was priced at 28.3 times its trailing 12-month earnings, well above the then-20-year average of 17.0. Many individual tech stocks were priced much higher.
'New era' rhetoric: Market bubbles often occur alongside big technological breakthroughs—railroads, electrification, and the internet, for example—that are heralded as offering a new era of productivity and profitability. But the potential is often exaggerated in the minds of enthusiastic investors. Just weeks before the October 1929 stock market crash that triggered the Great Depression, Business Week magazine wrote: "For five years at least, American business has been in the grip of an apocalyptic holy-rolling exaltation over the unparalleled prosperity of the 'new era' upon which we, or it, or somebody has entered."
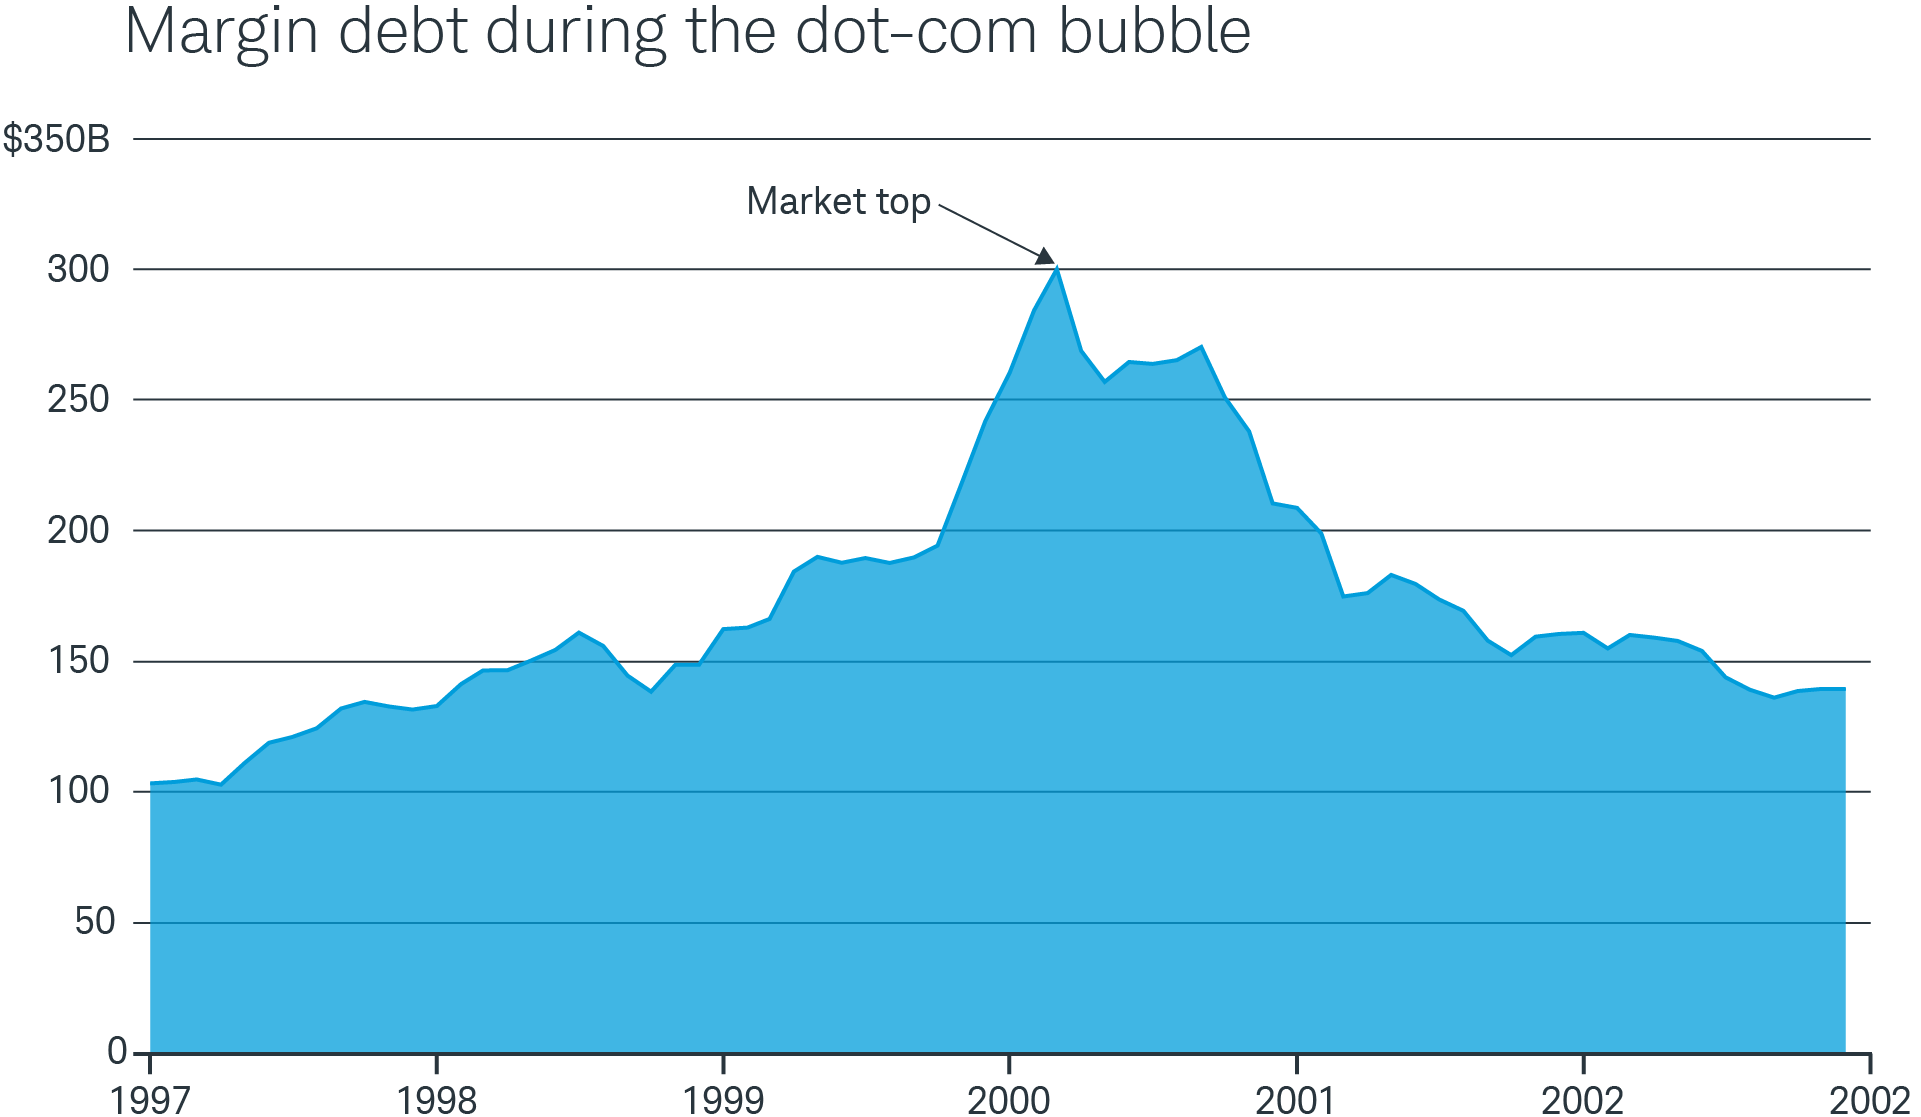
Speculative excess: The easy availability of capital, especially at low interest rates, frequently plays a role in creating asset bubbles by offering the possibility of amplified gains. Those gains, particularly in the later stages of a bubble, often draw in newer market participants who might be driven less by careful investing habits than by "fear of missing out" (FOMO). FOMO can be a powerful force in the creation of bubbles. The use of margin also frequently surges in later stages of a bubble.
Data source: FINRA
For illustrative purposes only. Past performance is no guarantee of future results.
Market psychology: Extreme bullishness among the investing public often serves as a useful, if subjective, indicator of a bubble. Time magazine covers have been frequently cited as contrarian indicators in the past. One money manager even created a Magazine Cover Indicator. After all, if everybody is in the market, there's no one left to buy. This can result in cascading waves of price declines once the selling starts.
Price collapse: A crash in prices is usually seen by many as confirmation of a bubble. Unfortunately, by then it's too late for any investors who are left holding the proverbial bag. A bear market is commonly defined as a 20% decline from a recent peak. But how far—or how quickly—do prices have to fall to qualify as a crash? For the purposes of their study of bubbles, economists Robin Greenwood, Andrei Shleifer, and Yang You defined a crash as a decline of at least 40% within two years of large price gains.
Predicting a crash
While the hallmarks of a bubble may be easily recognizable, the ability to predict how far it might inflate and when it will pop is notoriously difficult. A few people have shorted bubbles and won. Look at Michael Burry or John Paulson. Both made fortunes betting against derivatives linked to the U.S. housing bubble. But countless others, including top investors with abundant high-quality data and information at their disposal, were still exposed as the housing bubble burst, triggering the 2008 financial crisis.
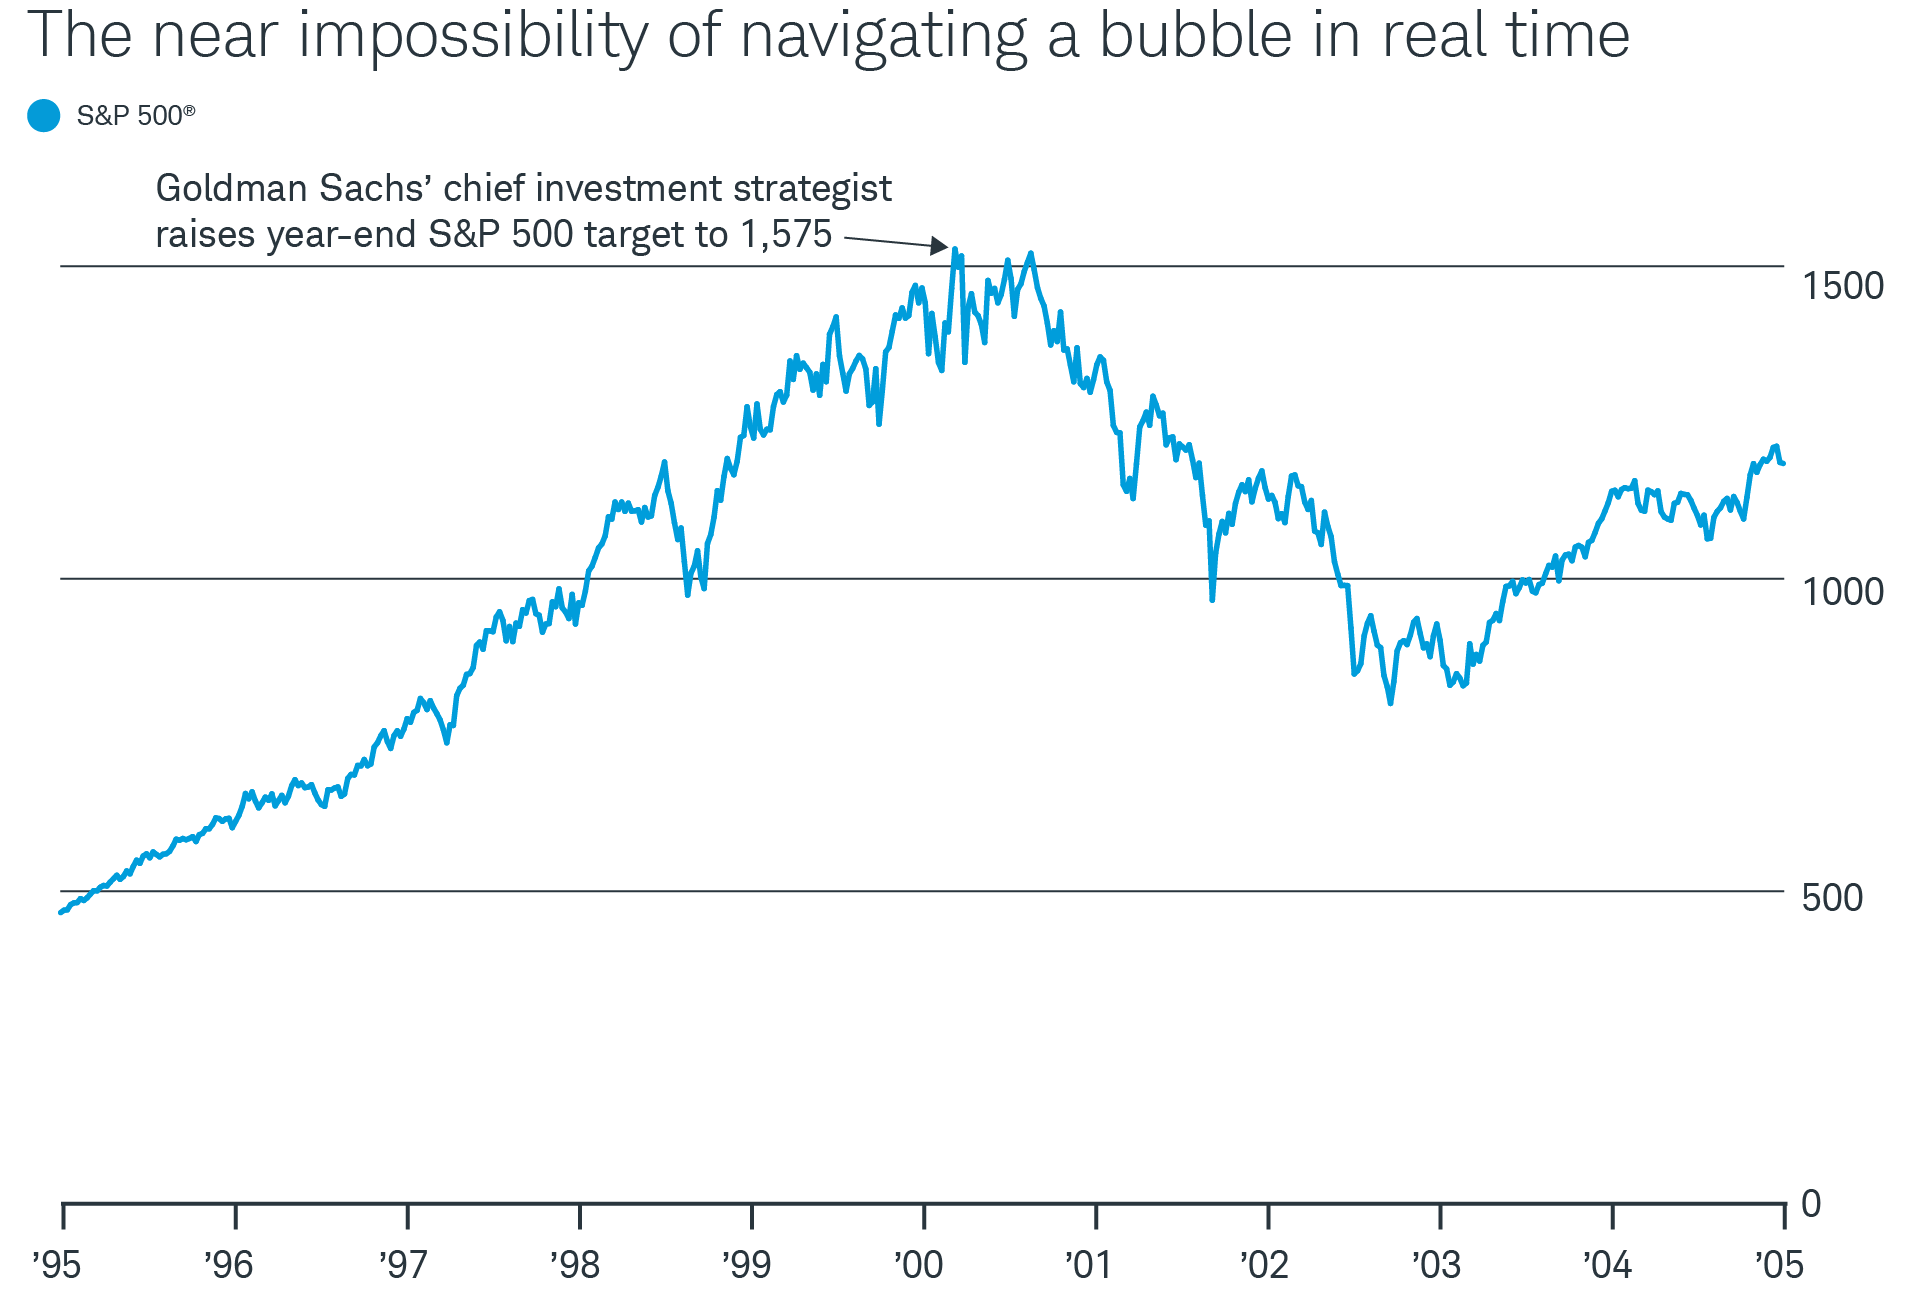
For example, in March 2000, at the very peak of the dot-com tech bubble, Abby Cohen, then Goldman Sachs' chief investment strategist, famously raised her year-end target for the S&P 500 to 1,575—just 5% above the close on the day of her call. It would take 13 years for the S&P 500 to close above her target.
Data source: S&P Dow Jones Indices
For illustrative purposes only. Past performance is no guarantee of future results.
When does a boom become a bubble?
The shortage of objective criteria is one of the reasons it's so difficult for investors to agree that a bubble has actually formed—and even more difficult to assess when it might be about to burst. In fact, statistical research hasn't produced a reliable way to quantify bubbles at all—that is, to identify a threshold at which a crash is predictable.
This bothers financial economist Eugene F. Fama, who shared the 2013 Nobel Prize for Economics for his work on the efficient market hypothesis, which states that asset prices reflect all available information, even if individual investors are not always rational. Looking at historical data, he found that extreme price gains, on average, don't even predict unusually low returns going forward. He argued that the collapse of strong price gains should be predictable if bubbles are a quantifiable phenomenon.
"It's a simple proposition. You have to be able to predict that there is some end to it. All the tests people have done trying to do that don't work," Fama said in 2016.
You don't need a meteorologist to know which way the wind is blowing. At least in a storm. But if a Nobel laureate can't produce hard rules for identifying bubbles, how can investors know when a boom has become a bubble or when optimistic valuations become irrational?
History of Market Bubbles
Testing Fama's bubble theory
Economists Greenwood, Shleifer, and You (mentioned above) took up the challenge laid down by Fama, whose claims contradicted much previous academic literature on the subject. They looked at stock prices within certain U.S. industries from 1926 through 2014, in search of 100% gains over a maximum period of two years. They identified 40 such episodes and found that only in 21 episodes did the industries fall at least 40%—their threshold for a crash—at some point in the next two years. (They also found similar results in a study of international stocks.)
In line with Fama's claims, the trio found that the 100% gains didn't predict lower returns than the broader stock market for those industries in the subsequent two years: "The historical accounts are typically based on burst bubbles, and do not take into consideration the fact that many industries have gone up in price a lot and just keep going up."
But Greenwood, Shleifer, and You also concluded that the probability of a crash after a 100% gain was higher than average, and that the probability rose further as gains exceeded 100%. They also found that industries that crashed differed in significant ways from those that didn't. Those that crashed showed higher price volatility and especially rapid gains, with newer companies experiencing disproportionately bigger gains.
| Minimum price increase | Number of industries rising by minimum | Industries that crashed within 2 years | Average decline during crash |
|---|---|---|---|
| 75% | 77 | 36% | 54% |
| 100% | 40 | 53% | 60% |
| 125% | 21 | 76% | 60% |
| 150% | 15 | 80% | 62% |
Those attributes, along with higher levels of stock issuance, could potentially help investors earn abnormally high returns by avoiding some of the crashes. However, the trio stressed that price peaks are "extremely hard to call" and betting against bubbles, especially by going short, is risky: "An arbitrageur would need to have extremely deep pockets and investors with high tolerance for volatility to make such bets."
Bottom line: Bubbles and rising risk
Financial markets are, among other things, a reflection of crowd psychology. That inevitably means that at times they will be driven by greed and fear more than cold calculation, and they will sometimes form what almost everyone can agree is a bubble, at least after the fact. While investors may not be able to predict when a bubble will burst, they can learn to recognize the conditions associated with rising risk and, perhaps, act accordingly.