Navigating the Global Earnings Boom

Key takeaways
- Corporate earnings have surged in recent quarters, handily beating estimates and providing fundamental support for global equity markets. However, this earnings boom has been unusually concentrated while consensus expectations about future growth have increased sharply, to levels typically only seen in early-cycle recovery periods.
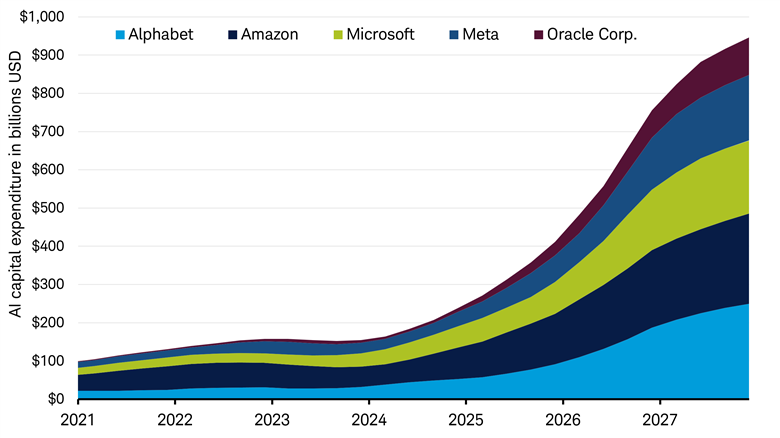
- Capital spending (capex) linked to the artificial intelligence (AI) buildout has been the big driver of the recent earnings acceleration with the largest technology firms planning to spend over $750 billion in aggregate in 2026 and close to $1 trillion in 2027, according to Bloomberg. This spending has boosted earnings in a select group of industries tied to AI infrastructure, including technology hardware, communications equipment, construction, and semiconductors.
- The Information Technology sector currently represents 31% of the MSCI All Country World Index (MSCI ACWI) by weight but is forecast to contribute 55% of total projected 2026 earnings growth. Most of this growth is coming from a handful of stocks in the U.S., Japan, and emerging markets. In short, an exceptionally narrow group of stocks is fueling the strong global profit growth expected this year and next.
- This investment wave presents both opportunities and risks for investors. A key challenge is navigating the AI investment cycle in a way that enables participation in potential market gains associated with these fast-growing industries, while guarding against the risks associated with high earnings expectations and hyper-concentrated growth.
- We continue to advocate for broad diversification in equity portfolios, including across regions, sectors, and themes. With expectations of continued strong AI-focused capex trends through next year, we do not foresee an imminent end to this profit cycle. However, we believe active diversification can help investors to participate in rapid growth areas while supporting portfolio resilience.
What makes this an earnings boom? There are several factors that distinguish an earnings boom from the typical growth seen during economic expansion. These factors include earnings growth well above average, persistently positive earnings revisions, improving corporate profitability, and increased corporate investment. The current environment contains all four elements.
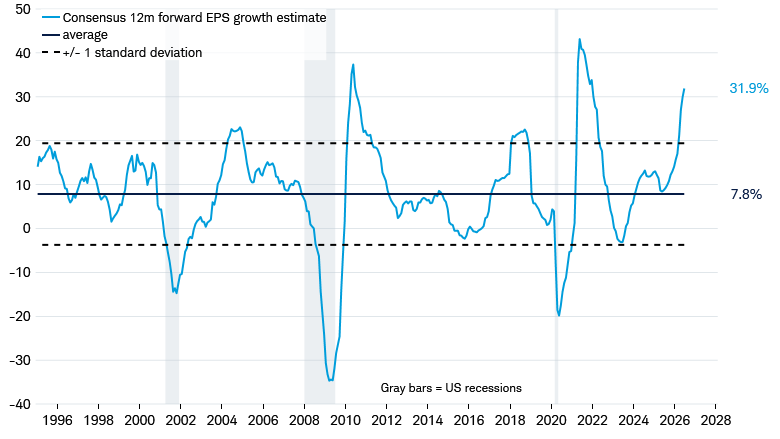
First, current consensus earnings growth estimates far exceed normal levels, particularly in the U.S. On a forward-looking basis, Bloomberg consensus estimates for the S&P 500 expect earnings to grow by about 32% over the next 12 months. That figure has only been higher during the recovery periods following the global financial crisis (GFC) and COVID-19 recessions.
S&P 500 one-year forward earnings growth estimates are typically only this elevated after an earnings recession
Source: Charles Schwab, Bloomberg, and Macrobond, data from 1/1/1995 through 7/6/2026.
Indexes are unmanaged, do not incur management fees, costs, and expenses and cannot be invested in directly. Standard deviation measures the dispersion of data points relative to their mean, indicating how spread out data points are from average. Forecasts contained herein are for illustrative purposes only, may be based upon proprietary research and are developed through analysis of historical public data. Past performance is no guarantee of future results.
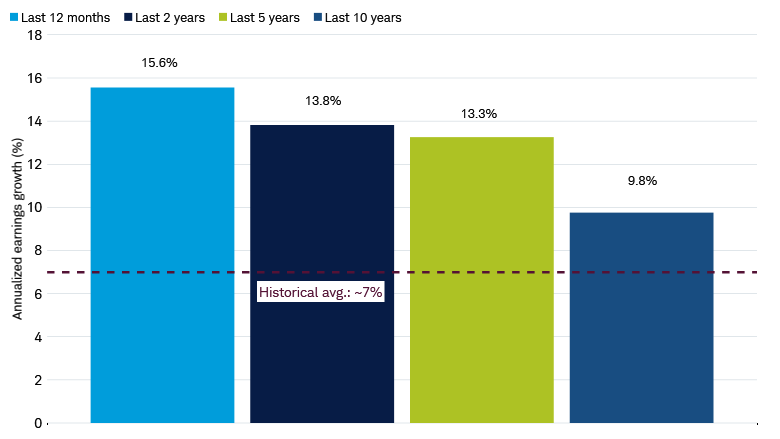
What is unusual about today's strong earnings growth is that it is coming after a prolonged period of robust growth (as opposed to after a recession where low base effects can make normalizing earnings growth look elevated). S&P 500 earnings grew 15% last year and over 13% annually over the last five years. This compares to the long-term historical average of about 7%, as seen in the chart below.
S&P 500 earnings per share (EPS) growth has been well above average over the last 10 years
Source: Charles Schwab and Bloomberg.
Data measure returns over respective trailing periods through 7/6/2026. Indexes are unmanaged, do not incur management fees, costs, and expenses and cannot be invested in directly. Past performance is no guarantee of future results.
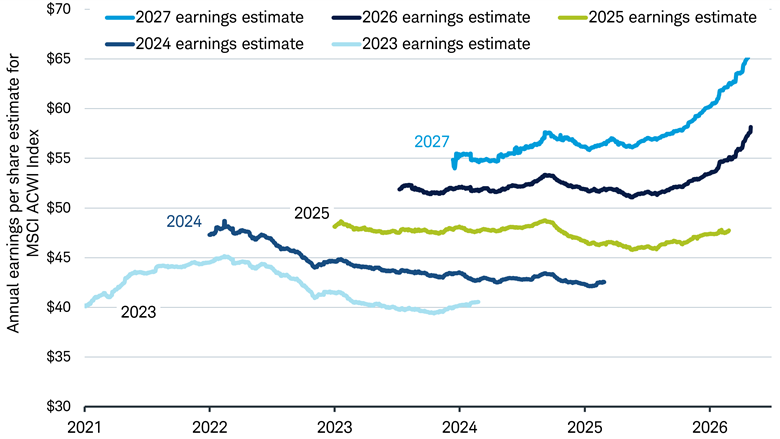
Second, for the last few quarters, we have seen strong upward earnings revisions for both 2026 and 2027 earnings expectations. In an average year, consensus earnings estimates are revised modestly lower over time, but recently earnings estimates have accelerated higher, a reflection of how much AI-related capital spending has been deployed and how it has tended to drive such a sharp jump in earnings.
Progression of annual consensus earnings estimates
Source: Charles Schwab and Bloomberg. Estimates from Jan. 1, 2021 through June 30, 2026.
Forecasts contained herein are for illustrative purposes only, may be based upon proprietary research and are developed through analysis of historical public data. Indexes are unmanaged, do not incur management fees, costs, and expenses and cannot be invested in directly. Past performance is no guarantee of future results.
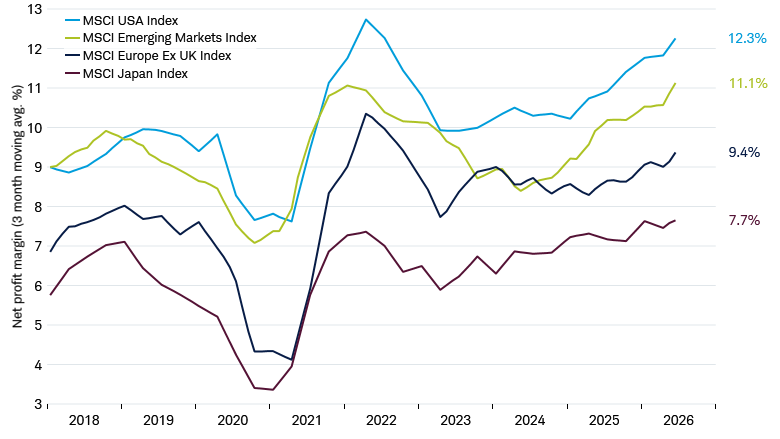
Third, the corporate sector is seeing strong improvement in profitability. Profit margins have gradually improved over the last few years as the corporate sector has made improvements in operating profitability since the COVID-19 period. These improvements, plus the sharp increase in AI investment, have caused a higher inflection in profit margins, particularly in the U.S. and emerging markets, which have the largest share of companies benefiting from the AI investment wave. However, if AI investment spending suddenly drops off, these companies could be negatively impacted.
Net profit margins on an improving trajectory
Source: Charles Schwab, Bloomberg, and Macrobond, as of 7/7/2026.
Indexes are unmanaged, do not incur management fees, costs, and expenses and cannot be invested in directly. Past performance is no guarantee of future results.
Additionally, the defining feature of this earnings cycle has been the sharp increase in investment capital being deployed into the AI buildout. Just five U.S. technology firms are expected to spend over $750 billion in 2026 alone, according to Bloomberg estimates. This is nearly double the rate spent in 2025 and up almost 400% over the last three years. Moreover, this spending is expected to further increase in 2027 and approach $1 trillion.
Every investment dollar spent by one company is another company’s revenue. And this wave of investment is powerful, driving sales growth for semiconductors, material suppliers, construction firms, and utilities. To put these numbers into perspective, the $750 billion in expected capital investment this year is more than 4% of the combined aggregate revenue of the S&P 500 in 2025, according to Standard & Poor's.
AI capital investment has ramped up sharply over the last few years
Source: Charles Schwab and Bloomberg. Estimates from 1/1/2021 through 12/31/2027, data as of 7/8/2026.
Forecasts contained herein are for illustrative purposes only, may be based upon proprietary research and are developed through analysis of historical public data. All corporate names and market data shown are for illustrative purposes only and are not a recommendation, offer to sell, or a solicitation of an offer to buy any security. Past performance is no guarantee of future results.
It's a global boom, but a concentrated one
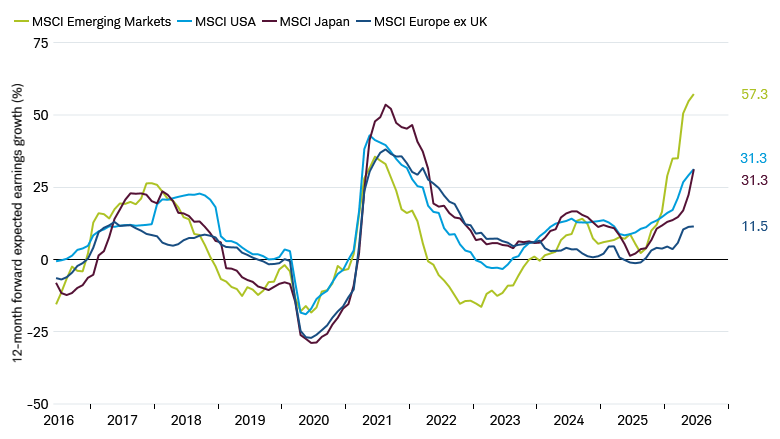
While U.S. technology firms may be doing most of the spending, the associated earnings boom has been global with emerging markets and Japan also participating. The MSCI Emerging Markets Index has benefited from a large weight in technology hardware and semiconductor companies. Japan's equity market has been supported in the same way, with industrial and automation firms seeing increased demand from global capital spending. However, because these markets have already seen meaningful exposure to AI-related beneficiaries, those same exposures could become a source of risk if AI-related capital spending slows, earnings expectations are not met, or investor sentiment toward technology, semiconductor, industrial, or automation-related companies weakens.
Regional 2026 expected earnings growth
Source: Charles Schwab and Bloomberg, as of 7/7/2026.
Indexes are unmanaged, do not incur management fees, costs, and expenses and cannot be invested in directly. Forecasts contained herein are for illustrative purposes only, may be based upon proprietary research and are developed through analysis of historical public data. Past performance is no guarantee of future results.
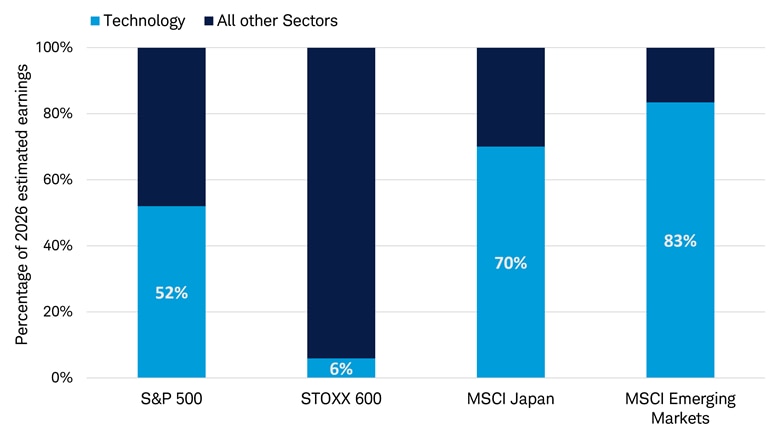
While aggregate earnings growth has improved, the contribution to this growth has been narrowly concentrated. Just a handful of companies, particularly semiconductors and digital platforms, are responsible for most of the aggregate growth. In the U.S., the Information Technology sector represents 37% of S&P 500 market capitalization but is expected to drive more than half of the projected earnings growth in 2026. In the MSCI Emerging Markets (EM) Index, technology is 45% of market cap but over 83% of expected earnings growth. In the MSCI Japan Index, technology is 21% of index weight but nearly 70% of expected earnings growth, according to Bloomberg's data on index composition and consensus estimates In short, a narrow group of sectors and stocks is fueling the bulk of profit gains worldwide.
Regional tech sector contribution to 2026 expected earnings growth
Source: Charles Schwab and FactSet, as of 7/7/2026.
Forecasts contained herein are for illustrative purposes only, may be based upon proprietary research and are developed through analysis of historical public data. Indexes are unmanaged, do not incur management fees, costs, and expenses and cannot be invested in directly. Past performance is no guarantee of future results.
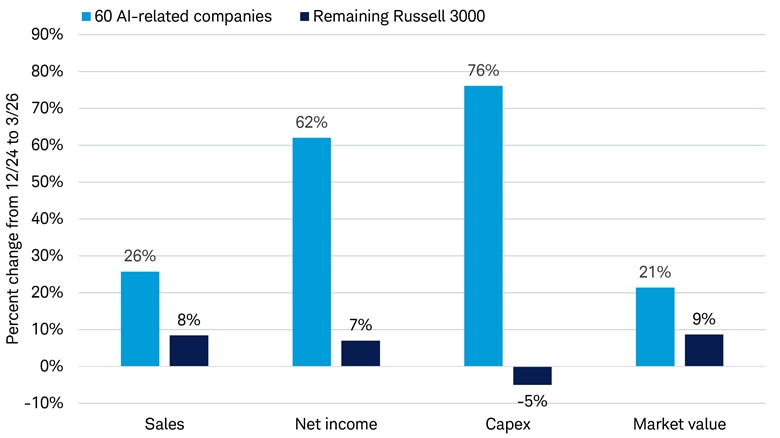
Another perspective on the strength and impact of the AI investment cycle is to look beyond sectors and focus on specific companies most tied to AI. Within the Russell 3000 Index, we identified 60 U.S. companies across Information Technology, Communication Services, Materials, Industrials, and Utilities that are exposed to critical parts of the AI infrastructure buildout, including the five companies doing the bulk of the spending.
Looking at changes since the start of 2025 shows these 60 AI stocks within the Russell 3000 Index generated three times faster revenue growth, more than eight times faster earnings growth, and more than double the appreciation in market value than the overall market, as seen in the chart below. Outside of these 60 companies, the rest of the market saw a slight reduction in capital spending.
Beneficiaries of AI investment vs. the rest of the market
Source: Charles Schwab and FactSet, as of 7/7/2026.
Forecasts contained herein are for illustrative purposes only, may be based upon proprietary research and are developed through analysis of historical public data. Indexes are unmanaged, do not incur management fees, costs, and expenses and cannot be invested in directly. Past performance is no guarantee of future results.
Risks: What could go wrong?
The current pace of AI-related capital investment does not show signs of slowing, and the rate of AI adoption across economies remains early with many companies only just beginning to explore its potential enhancements. Moreover, economic conditions outside of the AI investment wave remain healthy, which should continue to support global earnings growth. Central risks to an earnings boom—including severe overcapacity, demand contraction, or policy intervention—do not seem imminent but could materialize.
The primary risk we see today is an unexpected deceleration of AI-related capital spending, which would likely impact those industries that are currently benefiting from this cycle. Continued growth of data centers is reliant on increased power generation as well as local permitting regulations that enable construction. Potentially higher interest rates or tighter financial conditions might limit future capital expansion in infrastructure through higher corporate borrowing costs.
Beyond potential near-term risks, it could take time to understand what the returns on all this investment will look like. Should those returns fail to meet expectations, market values would likely adjust lower. In areas where demand is currently exceeding supply and enabling premium pricing and supercharged earnings growth, increased supply or technological innovation could negatively impact the outlook.
From our perspective, the combination of high earnings growth expectations and elevated valuations presents downside risks.
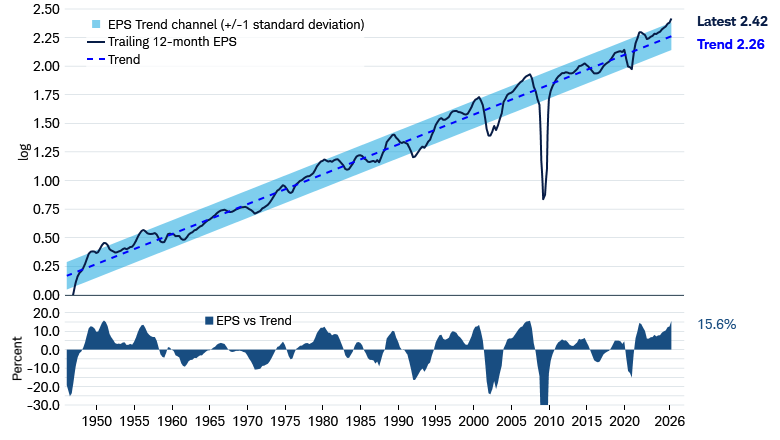
The following chart shows a 75-year history of S&P 500 earnings per share (EPS) with trend line and channel of +/- one standard deviation overlaid. The chart shows that the earnings delivered over the last 12 months were 20% above the long-term trend line. This is the highest spread above the trend in the history of this series.
S&P 500 trailing 12-month EPS (as reported) relative to trend
Source: Charles Schwab and Robert Shiller, as of 7/6/2026.
Past performance is no guarantee of future results. Standard deviation measures the dispersion of data points relative to their mean, indicating how spread out numbers are.
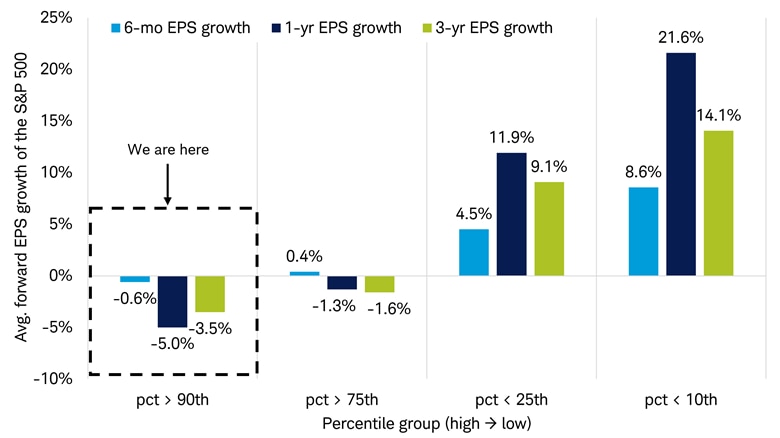
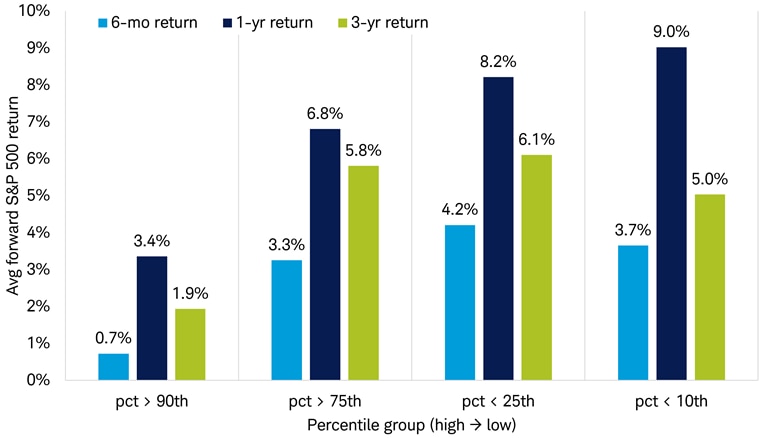
Looking back at this data, we have analyzed the spread between realized EPS and the trend, grouping the series into percentiles. We have then measured the forward EPS growth, and market returns over subsequent six months, one year, and three years. The results of this analysis show an inverse relationship—the higher historical EPS has been above trend, the weaker future earnings growth and returns have been, as seen in the charts below.
We caution against taking these results literally; we do not know whether the historical trend will remain relevant. However, the basic idea is straightforward: the stronger recent earnings growth has been, the weaker future growth becomes, especially when at extremes. We note comparable results when measuring earnings expectations, too.
The higher prevailing earnings are vs. long-term trends, the lower future earnings growth has tended to be
Source: Charles Schwab, Bloomberg, and Robert Shiller, as of 7/6/2026.
Analysis based on data from December 1945 to June 2026. Past performance is no guarantee of future results.
The higher earnings are relative to long-term trends, the lower future returns have been
Source: Charles Schwab, Bloomberg, and Robert Shiller, as of 7/6/2026.
Analysis based on data from December 1945 to June 2026. Past performance is no guarantee of future results.
Do not get us wrong, strong earnings growth is a clear positive for equity returns, but history reminds us that an earnings boom can bring risks, particularly if investors overpay for lofty expectations that are ultimately unmet.
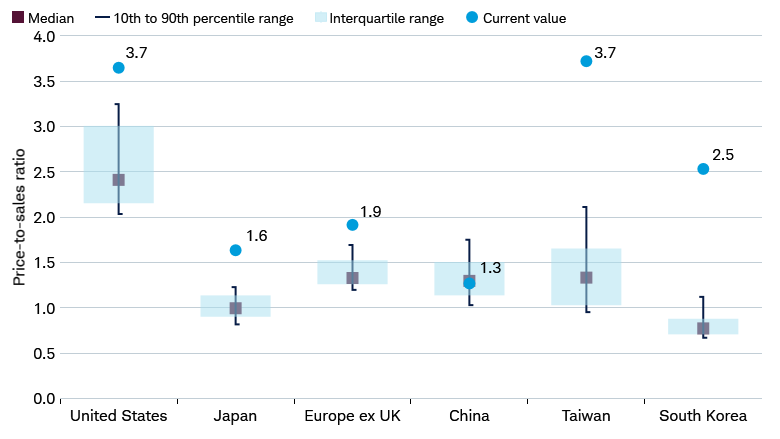
There are signs that these risks could be growing. Earnings have boomed, expectations are high, and valuations are at the high end of the range of the last 20 years across most major markets. The price-to-sales ratios for the U.S., Japan, Europe, China, Taiwan, and Korea (the largest countries in MSCI Developed Market (DM) and Emerging Markets indexes, respectively) are well above 20-year ranges.
Price-to-sales ratios above the ranges of the last 10 years
Source: Charles Schwab, MSCI, and Bloomberg, as of 7/7/2026.
MSCI USA, MSCI Japan, MSCI Europe ex UK, MSCI China, MSCI Taiwan, and MSCI Korea indexes. Indexes are unmanaged, do not incur management fees, costs, and expenses and cannot be invested in directly. Past performance is no guarantee of future results.
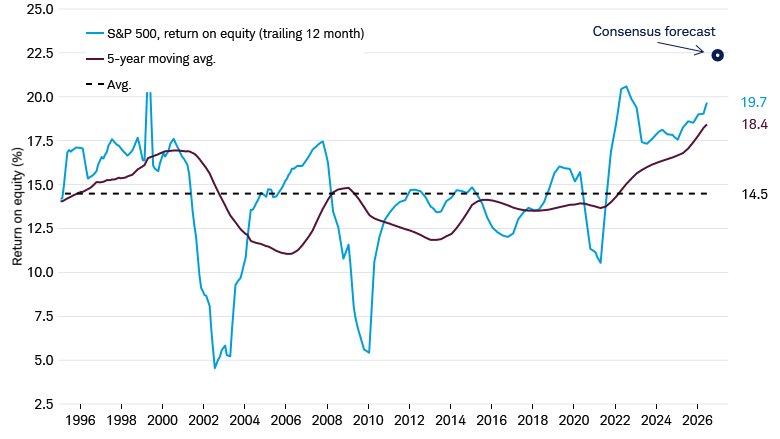
We also see elevated expectations in terms of consensus estimates around corporate profitability. The return on equity (ROE) of the S&P 500 over the last 12 months has been just under 20%. Consensus estimates are calling for ROE to expand to a record 22.5% over the next year. Our analysis shows these expectations seem to be already priced into markets.
Consensus expectations are for record, sustained profitability gains
Source: Charles Schwab, MSCI, and Bloomberg, as of 7/7/2026.
Indexes are unmanaged, do not incur management fees, costs, and expenses and cannot be invested in directly. Forecasts contained herein are for illustrative purposes only, may be based upon proprietary research and are developed through analysis of historical public data. Past performance is no guarantee of future results.
Investment implications
For investors, the global earnings boom offers both opportunities and risks. On the positive side, robust profit growth may continue to support equity market returns. It may be premature to bet on an end to the cycle while earnings momentum remains strong, revisions are still moving higher, leading macro indicators are improving, and plans for capital expenditure are expanding. Reducing equity exposure too early in a bull market can mean missing potential gains.
However, caution is warranted. Portfolios should avoid excessive concentration in a small subset of AI investment beneficiaries. Instead, seek diversified participation. That can mean owning both the "haves" and some of the overlooked "have-nots." For example, investors might balance exposure to AI investment beneficiaries with high-quality companies in sectors like Consumer Staples, Health Care, or Utilities, which may offer earnings stability and relatively low correlation to the AI theme.
Thus far in 2026, stocks with strong earnings momentum have outperformed sharply. That trend may persist as long as the earnings boom continues to outpace investor expectations. And, as we have seen, expectations have increased dramatically. If upside surprises and upward revisions continue, the boom will likely roll on. However, if the revision trend fades or reverses, that may be the first sign that this earnings-driven market is transitioning to its next phase. Given elevated expectations for growth and the higher bar, future returns could be lower than average.
We continue to espouse broad diversification in equity portfolios, including across regions, sectors, and themes. With expectations of continued strong AI-focused capex trends through next year, we do not foresee an imminent end to this profit cycle. However, we believe active diversification can help investors to participate in rapid growth areas while supporting portfolio resilience.