How to Tell If a Market Is Overbought or Oversold

If a trader's strategy is to buy low and sell high, any metric that flashes "overbought" or "oversold" would seem to offer the perfect signal. But taking those readings at face value can be risky—and expensive.
As measured by technical indicators, markets can stay at overbought or oversold levels for days or weeks. Relative to fundamental measures like price-to-earnings ratios, a security's exit from these levels could take months or even years. Plenty of "overbought" stocks never look back, while many "oversold" ones never recover.
So what does it actually mean when a security is overbought or oversold? It means prices are moving relatively fast in one direction and may not keep doing so. They aren't buy or sell signals. But if understood in context, they can provide short-term traders and investors some insight when making entry and exit decisions.
Most traders and investors use a handful of metrics—some technical and some fundamental—to judge whether a market is getting stretched. Experienced ones also consider broader market conditions. An overbought or oversold reading in one set of conditions can mean something much different under others. And arguably, the most important of those conditions is the trend.
Technical readings
When people say a market is overbought or oversold, they usually mean a certain technical indicator has reached an extreme level. The most popular of these indicators—the Relative Strength Index (RSI) and the stochastic oscillator—gauge momentum. They measure how far and how fast the price of a security or index has moved in relation to its own recent prices.
Relative Strength Index
RSI readings range from zero to 100, with 70 considered overbought and 30 considered oversold. Traditionally, some traders have taken a move from above 70 to below 70 as a sell signal, while many interpreted a cross from below 30 to above 30 as a buy signal. But during strong trends (up or down), a move can have plenty of legs left long after the RSI has crossed 70 or 30. (In fact, some traders adjust their RSI thresholds to 80 and 20 when the trend is strong.)
Consider the RSI in the Nvidia (NVDA) chart below. It spent a month almost entirely above 70 in June and July 2025. Meanwhile, the price rose 13%. Obviously, anyone who exited on the first overbought reading would have missed out on those gains, and anyone who took 70, or the first cross below 70, as a short signal would have lost money.
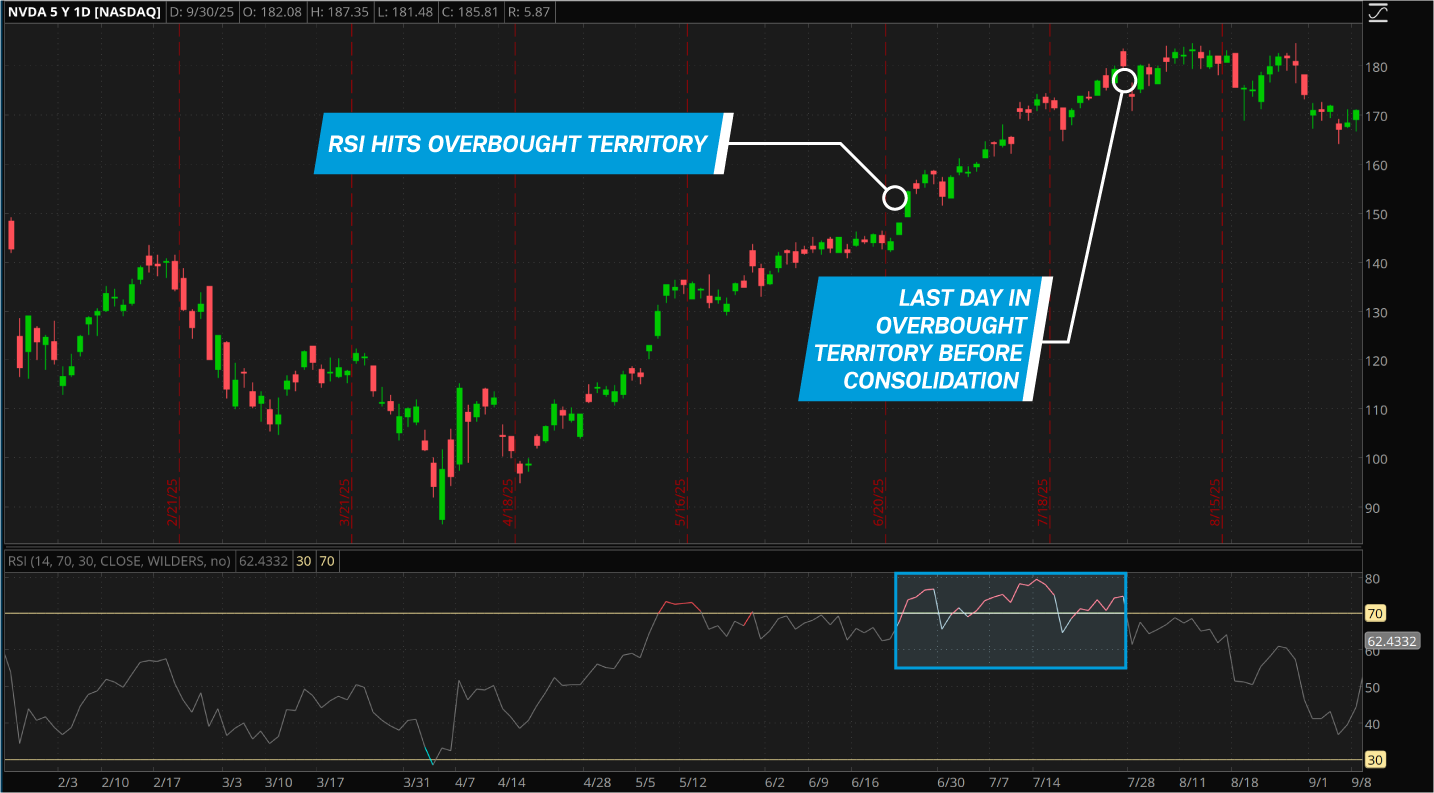
Source: thinkorswim® platform
For illustrative purposes only. Past performance is no guarantee of future performance.
Still, an overbought/oversold RSI reading can help flag momentum extremes, including when momentum might be starting to fade. It's up to the individual trader to stay alert to what's happening and decide what it means to their trading strategy. One use of an overbought or oversold indicator is to provide a potential signal to step aside rather than chase prices at an increasingly less-favorable risk-reward ratio.
Momentum divergence at extreme RSI levels may also offer a useful signal: that's when price makes a higher high (or lower low), pulls back or consolidates, and then makes a higher high (or lower low), but the RSI doesn't keep pace, instead printing a lower high (or higher low). Many traders who are already in the market use momentum divergence, along with a cross below or above overbought/oversold, as a sign to exit the trend.
Stochastic oscillator
The stochastic oscillator compares the most recent closing price to its price range over a set number of trading periods (the default is 14). Some short-term traders find it useful because of its sensitivity to short-term price movements. Like the RSI, it swings between 0 and 100, but extremes are viewed differently, as readings above 80 are considered overbought and below 20 oversold.
The stochastic indicator shows two lines: the %K line, a measure of the most recent closing price with its recent price range, and the %D line, a three-period moving average of the %K line. The %K line crossing the %D line is a standard signal, strengthened when a bearish crossover occurs above 80 and a bullish crossover happens below 20.
Another standard sell signal is when the %K line crosses from overbought to below 80, while a cross above 20 from below would traditionally signal a buy.
As with the RSI, many traders look for momentum divergence at extreme levels as a sign that the prevailing trend may be coming to an end.
Assessing the trend
Context is key when using any indicator, but especially when deciding whether to act based on an overbought or oversold reading. It's crucial to first determine whether a market is trending or consolidating. An overbought or oversold reading is often a sign of a strong trend—and trading against a strong trend can be a high-risk, low-return bet. Even when a strong trend dies out, the market may just consolidate sideways.
Average Directional Index
Both the RSI and stochastic indicators are more effective at identifying potential turning points in range-bound markets than trending ones, so traders often use them alongside the Average Directional Index (ADX), which measures a trend's strength.
ADX readings above 25 suggest a strong trend, while readings below 20 indicate a weak trend or sideways market. An ADX that's rising means the trend is strengthening; if it's falling, the trend is weakening.
So if the RSI is flashing "overbought" and the ADX is above 25 and rising, the move may still have legs. If the ADX is falling, an overbought reading is more likely to signal a stall or reversal. Both the numerical reading and direction of the ADX line are important. A falling ADX that's still at, say, 45, could mean the trend, though weakening, remains strong and the move could still have legs.
The daily chart of Intel (INTC) below shows how the stochastic and ADX are used to identify turning points in range-bound markets. Four bullish crossovers below or at the 20 level on the stochastic indicator occurred in a 10-month period, with price moving immediately higher in three instances. Importantly, in all cases the stock was consolidating, weakening, or coming out of a short uptrend. In no case was a downtrend in place. (Note: Past performance does not guarantee future results.)
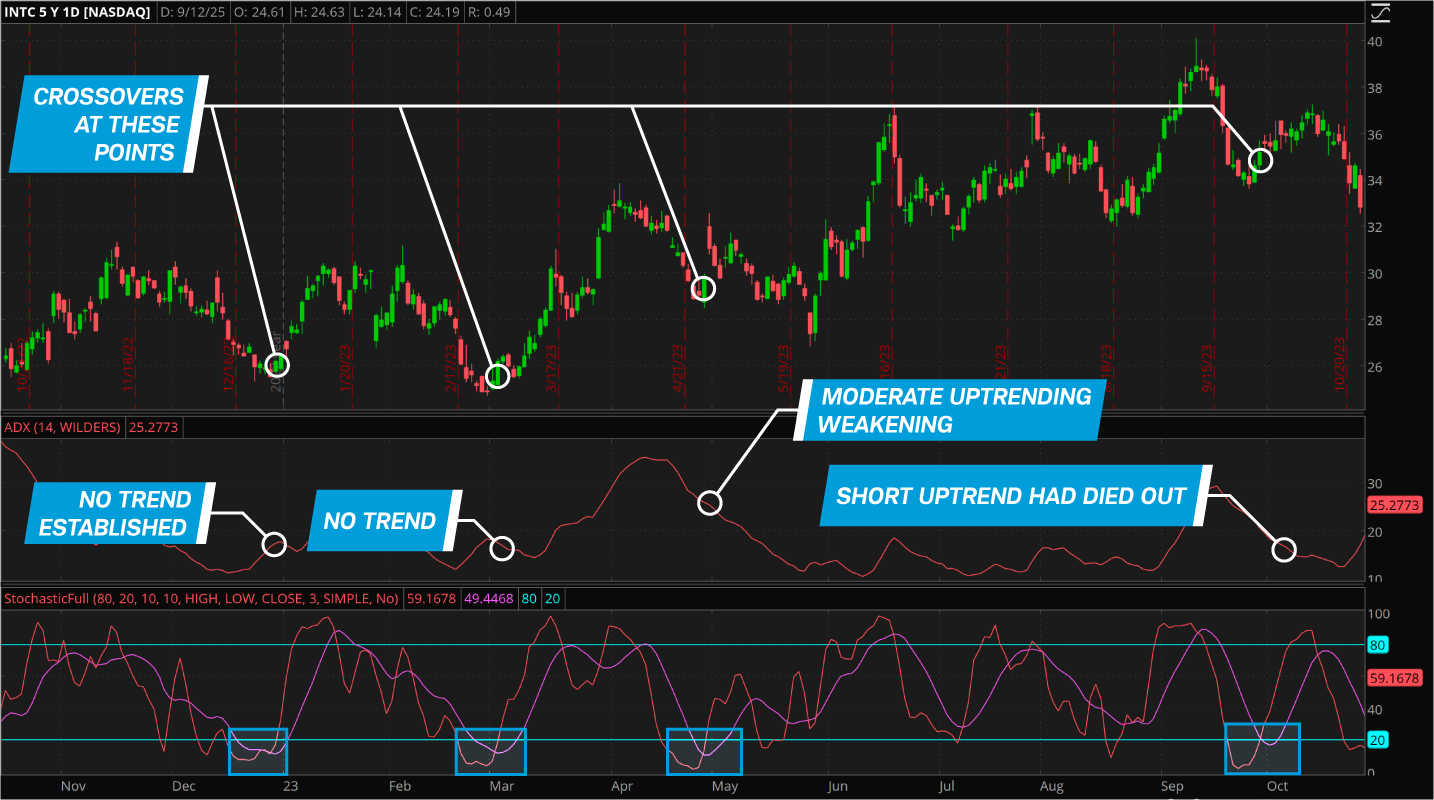
Source: thinkorswim platform
For illustrative purposes only. Past performance is no guarantee of future performance.
Fundamental readings
Many short-term traders look little—if at all—at fundamentals, as their systems are usually based on technical analysis. But fundamental readings of overbought and oversold can be useful for equity investors looking for an entry point or considering where and when to take profits.
What does it mean to be overbought based on fundamentals? It means the share price has moved too far beyond what the business earns or owns, its underlying value. The inverse is true for oversold.
Price-to-earnings ratio
The price-to-earnings (P/E) ratio is the most-used fundamentals-based metric of whether the market may consider a stock or index overpriced. The P/E compares a company's share price to its earnings per share (EPS) over the past 12 months, essentially telling potential investors how much they would pay for each dollar of a company's earnings. (Note: There are trailing and forward P/Es. Trailing P/E is based on reported earnings, while forward P/E is based on projected earnings.)
For example, if a company's stock is trading at $15 per share and its earnings are $1 per share, its P/E would be 15/1, or 15.
But as with technical indicators, a "high" P/E is relative. Some companies run much higher P/E ratios because investors believe future earnings justify premium prices. Others trade at much lower P/E ratios, reflecting modest growth expectations. A P/E of 30 might look insane for a utility company but perfectly reasonable for an AI startup. So when considering P/E, investors look not so much at absolute numbers as at historical ranges for a company, sector, or index.
As with technical indicators, a stock or an index can run at heightened or lowered P/E ratios for a long time before the price reverts to the mean. For example, the S&P 500's trailing P/E hit 40 at the end of 2020, nearly double its 20-year median of 22, as investors piled into certain tech companies they thought would capitalize on the outbreak of Covid-19. But the S&P rose 27% the following year before finally entering a 9-month bear market.
Price-to-book ratio
Another fundamentals-based price indicator is the price-to-book (P/B) ratio. The book value is equal to the net value of a company's assets minus its liabilities, and the P/B ratio is the stock price over the book value per share. A P/B of 1.0 means investors are paying exactly what its assets are worth on paper. A ratio of 5 or 10 means they're paying a huge premium for growth expectations.
As always, context matters. Some companies, like banks and industrials, will generally track close to book value, while hot tech names will soar far above it. As with P/E, it's most useful to compare P/B to historic ranges, and to keep in mind that stretched valuations only serve as a warning, not a sign of an imminent reversal.
Contrarian sentiment indicators
Traders use several lesser-known sentiment gauges to look for potential market turning points, especially in conjunction with technical indicators. Here are three of the most commonly used measures of market sentiment.
Put/call ratio: The put/call ratio is a contrarian sentiment gauge. It measures whether options traders are more bearish or bullish (whether they are placing more bets that prices will rise or fall), and traders use extreme levels in the ratio as indicators of extreme exuberance or fear, reasoning that extreme sentiment often signals the exhaustion of a trend and a market reversal. Like other indicators, traders view this ratio not in absolute levels but in relation to longer-term trends.
Commitments of Traders: Published weekly by the Commodity Futures Trading Commission, the Commitments of Traders report is also a source of contrarian clues for traders and investors. Similar to the put/call ratio, extreme levels of net long or short positions in the futures market may be read as contrarian signs of a potential reversal.
AAII Investor Sentiment Survey: The weekly survey by the American Association of Individual Investors asks individual investors where they think the market is headed in the next six months. Again, extreme bullishness or bearishness often precedes market turning points, enabling more-daring traders and investors to enter the market just as the prevailing crowd grows exhausted.
Bottom line
"Overbought" and "oversold" don't mean what most people would think. Crowd behavior will typically drive prices to extremes, and stocks and other securities can stay there for months if the trend and story are strong. It's best to consider "overbought" and "oversold" readings as warnings that a strong move is underway and that the music could stop (or not!) at any time.
As always, experienced traders consider all the evidence available. The RSI, stochastic, and ADX indicators paint a technical picture, P/E and P/B offer fundamental perspectives, and sentiment indicators provide clues to potential extremes in bullishness and bearishness.