Great Moderation Era: Drift(ing) Away

Key takeaways
- The Great Moderation has given way to a more "temperamental" backdrop marked by higher macro volatility, more frequent supply shocks, and greater geopolitical instability.
- Inflation volatility—not just the level of inflation—is likely to remain a key market driver, complicating the Federal Reserve's job and keeping stock-bond relationships less reliable.
- This new era may create a more volatile, dispersion-heavy environment that may favor diversification, flexibility, and factor-based investing rather than relying on the old playbook of broad index gains and a dependable Fed backstop.
- The Great Moderation has given way to a more "temperamental" backdrop marked by higher macro volatility, more frequent supply shocks, and greater geopolitical instability.
- Inflation volatility—not just the level of inflation—is likely to remain a key market driver, complicating the Federal Reserve's job and keeping stock-bond relationships less reliable.
- This new era may create a more volatile, dispersion-heavy environment that may favor diversification, flexibility, and factor-based investing rather than relying on the old playbook of broad index gains and a dependable Fed backstop.
In a September 2023 report, we pondered the idea that the Great Moderation Era—the two decades leading up to the pandemic marked by disinflation, suppressed volatility, and cheap access to goods, energy, and labor—had concluded, giving way to a backdrop akin to what we experienced in the 1960s until the 1990s, which we labeled the Temperamental Era.
In that report, we hypothesized that a new secular backdrop had emerged—one in which inflation is more volatile, the geopolitical landscape is increasingly unstable, and supply shocks are more frequent and powerful. Nearly three years later, it appears that a new version of the Temperamental Era is no longer a hypothesis, rather it's a new operating environment, but crucially—as we initially stated—not one in which the investing backdrop is worse (just different).
A hypothesis no more
Our initial analysis contrasted the two secular eras across a handful of key dimensions: economic volatility, inflation behavior, the labor-versus-profits split, demographics, geopolitical fragility, and the stock-bond correlation. (Each of these dimensions has slightly different start and end points associated with the Temperamental and Great Moderation Eras.) Most of these fault lines have since cracked open further. The table below is updated from the original.
A study in contrasting eras
-
Temperamental Era
(mid-1960s through mid-1990s) -
Great Moderation Era
(mid-1990s through 2021)
-
Temperamental Era
(mid-1960s through mid-1990s)Heightened economic volatilityGreat Moderation Era
(mid-1990s through 2021)Suppressed economic volatility-
Temperamental Era
(mid-1960s through mid-1990s)More frequent recessions, more robust expansionsGreat Moderation Era
(mid-1990s through 2021)Less frequent recessions, less robust expansions-
Temperamental Era
(mid-1960s through mid-1990s)Heightened inflation volatilityGreat Moderation Era
(mid-1990s through 2021)Disinflation-
Temperamental Era
(mid-1960s through mid-1990s)Heightened geopolitical volatilityGreat Moderation Era
(mid-1990s through 2021)Globalization "GELed" with cheap Goods, Energy, Labor-
Temperamental Era
(mid-1960s through mid-1990s)Labor (wages) larger share of GDP than profitsGreat Moderation Era
(mid-1990s through 2021)"Fed put": Profits dominate share of GDP-
Temperamental Era
(mid-1960s through mid-1990s)Negative yields/stocks correlationGreat Moderation Era
(mid-1990s through 2021)Positive yields/stocks correlation
Is inflation volatility back?
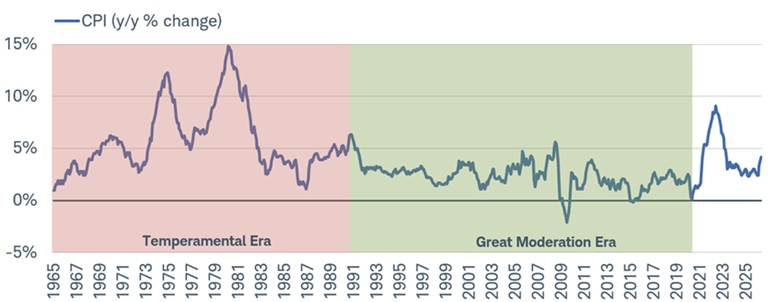
In the chart below, you can see a clear distinction between the level of inflation volatility in each of the two eras driven to a higher range starting in the pandemic-induced surge in the consumer price index (CPI) in 2022. We do not believe we're likely to see quite the level of heightened volatility as what existed during the original Temperamental Era. However, we do believe that the Federal Reserve's 2% inflation target will be more difficult to hit and that inflation could operate in a wider range than was the case during the Great Moderation Era.
More inflation volatility ahead?
Source: Charles Schwab, Bloomberg, and Bureau of Labor Statistics (BLS), as of May 31, 2026.
Correlation change
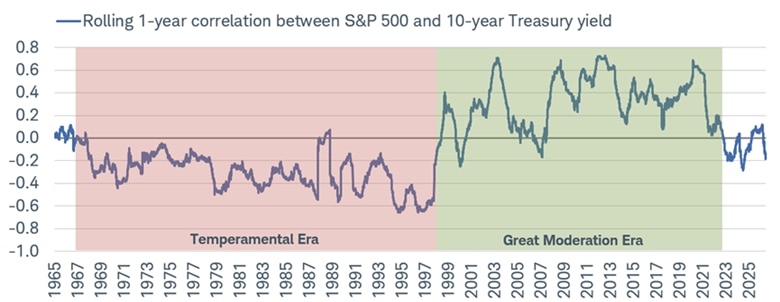
The rolling one-year correlation between the U.S. 10-year Treasury yield and the S&P 500 has been fluctuating near the zero line, as shown in the chart below. Clearly, there was a distinct difference between the two eras. At its core, the difference was driven by inflation and the bond market's reaction function. During the Temperamental Era, the 10-year yield tended to key off inflation, which meant rising yields were a reflection of higher inflation and therefore troublesome to equities. The opposite was the case when yields were falling. During the Great Moderation era, inflation was more subdued, which meant the 10-year yield tended to key off economic growth, which meant rising yields were a reflection of stronger growth (without attendant higher inflation) and therefore tended to be beneficial to equities. The opposite was the case when yields were falling.
Longer-term yields/stocks relationship
Source: Charles Schwab, Bloomberg, as of 7/2/2026.
Correlation is a statistical measure of how two investments have historically moved in relation to each other, and ranges from -1 to +1. A correlation of +1 indicates a perfect positive correlation, while a correlation of -1 indicates a perfect negative correlation. A correlation of zero means the assets are not correlated.
Indexes are unmanaged, do not incur management fees, costs and expenses and cannot be invested in directly. Past performance does not guarantee future results.
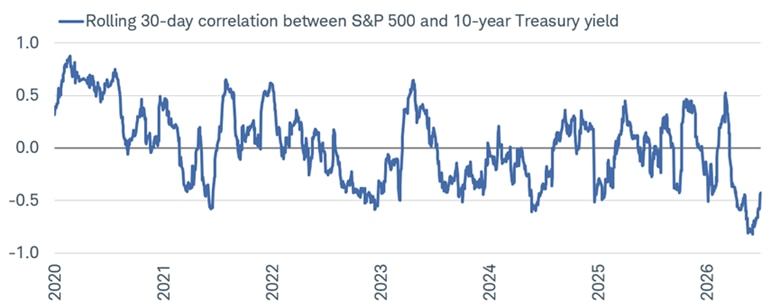
As a sign of a potential new version of the Temperamental Era, below is a shorter-term correlation on a one-month rolling basis. It has moved decisively into negative territory, highlighting that inflation risk is front and center again.
Shorter-term yields/stocks relationship
Source: Charles Schwab, Bloomberg, as of 7/2/2026.
Correlation is a statistical measure of how two investments have historically moved in relation to each other, and ranges from -1 to +1. A correlation of +1 indicates a perfect positive correlation, while a correlation of -1 indicates a perfect negative correlation. A correlation of zero means the assets are not correlated.
Indexes are unmanaged, do not incur management fees, costs and expenses and cannot be invested in directly. Past performance does not guarantee future results.
Less GEL (goods, energy, labor), more chop
In 2023, we noted that economic forces were "GELing" together in the Great Moderation Era, made possible via abundant and cheap access to Goods, Energy, and Labor—courtesy of globalization, the U.S. shale boom, and China's entry into the World Trade Organization (WTO). We expected all three ships to keep sailing, but with more chop. Yet, on all three fronts, the chop arrived faster and more furious than we could have anticipated.
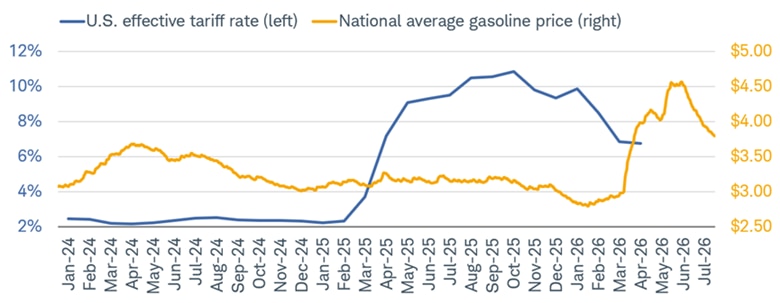
Within goods, tariffs have been the most visible force. The effective U.S. tariff rate surged from a low of 2.2% at the start of 2025 to a peak of 10.8% in October 2025—the highest level in nearly a century. That ushered in a period of heightened instability for global trade, inclusive of several tariff exemptions, tit-for-tat disputes between the United States and China, and an eventual Supreme Court ruling that struck down President Donald Trump's use of emergency authority in imposing retaliatory tariffs. As a result, goods inflation became increasingly volatile and hasn't yet settled back to its pre-Liberation Day (April 2, 2025) average.
The energy sector has seen an equally volatile backdrop, with the February 2026 U.S. strikes on Iran—and attendant halting of traffic through the Strait of Hormuz—helping send oil prices to their highest since Russia's invasion of Ukraine in 2022. For U.S. consumers, the pain was felt acutely at the pump, with the national average gasoline price spiking above $4.50/gallon (also the highest since 2022), according to Bloomberg and shown below. This was a significant supply shock, coming not even a full year after Liberation Day, which dealt another jolt to inflation volatility.
Back-to-back supply shocks
Source: Charles Schwab, Bloomberg. Tariff rate as of 4/30/2026. Gasoline prices as of 7/5/2026.
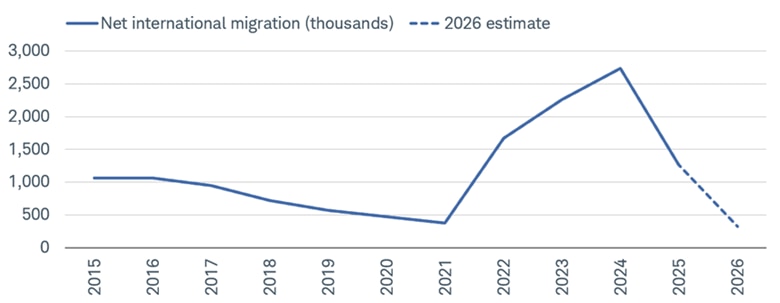
The picture of the labor market is more nuanced. Wage pressures have moderated from their post-pandemic peaks, but the demographic headwinds we flagged in 2023—the rising age-dependency ratio both in the United States and globally—continue to tighten long-run labor supply. Exacerbating the supply issue is the fact that immigration has slowed down sharply in the United States, with the latest data from the U.S. Census Bureau showing that net international migration fell from 2.7 million people in 2024 to 1.3 million people in 2025. As shown below, estimates for 2026 are quite low at just 321,000 based on current trends.
Sharp slowdown in net migration
Source: Charles Schwab, U.S. Census Bureau, and Vintage 2025 Population Estimates, as of 1/27/2026.
Forecasts contained herein are for illustrative purposes only, may be based upon proprietary research and are developed through analysis of historical public data.
Labor's profits vs. corporate profits
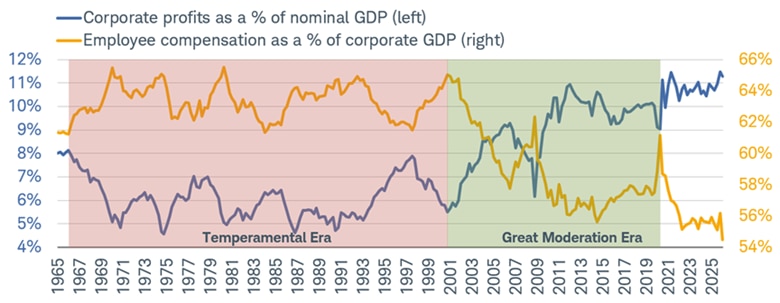
One of the starkest distinctions between the two secular eras has always been the relative claim of labor and capital on the economy's output. As shown below, during the Temperamental Era, employee compensation represented a larger relative (notice the different scales) share of gross domestic product (GDP) versus corporate profits. That relationship flipped decisively as the Great Moderation took hold. From the dot-com-bubble burst onward, profits surged to record highs as a share of GDP, aided by globalization suppressing wage costs, the "Fed put" (the belief that the Fed will intervene during downturns) backstopping asset prices, and a steady decline in unionization and labor bargaining power. Labor's share, meanwhile, drifted lower for two decades, briefly spiking during the pandemic as profits cratered, then quickly reverting.
Profits continue to dominate
Source: Charles Schwab, Bloomberg, as of 3/31/2026.
It may be a while before a convergence with these two forces. If the AI (artificial intelligence) capital spending supercycle delivers on its productivity promise—automating cognitive work, compressing labor costs per unit of output, and expanding margins in software-intensive industries—corporate profits could sustain elevated GDP share even as nominal wages rise.
Geopolitics' strain on central banks
While it is a coincidence that the three largest supply shocks over the past couple years have happened to live in the sectors that comprise the aforementioned GEL architecture, we don't think it's a mistake that they have a shared geopolitical transmission mechanism. We continue to think we may remain in an era of heightened geopolitical volatility, which has already led to instability (a key theme in our outlook for 2026). That, in turn, means we are increasingly at risk of supply-driven inflation shocks, for which global central banks have few (if any) successfully combative tools.
In a new Temperamental Era, ripple inflation pressures have the potential to be far-reaching and sharp. That is perhaps clearest with the Strait of Hormuz traffic closure, which didn't just raise oil prices, but disrupted roughly 30% of global fertilizer exports, threatened food security heading into the Northern Hemisphere planting season, and forced central banks to confront a stagflationary impulse that their frameworks weren't designed to handle gracefully, according to International Food Policy Research Institute.
Today's central bankers will likely continue to face this dilemma. Before his nomination, newly appointed Federal Reserve Chair Kevin Warsh argued that AI-driven productivity gains were structurally disinflationary and that rates could adjust downward accordingly. Not only has the Iran war complicated the task of inflation returning to 2%, but AI has thus far proven to be a driver of price pressures to the upside, with prices of tech equipment and software soaring over the past year.
Combined with stickier services inflation, which is reaccelerating, the backdrop looks increasingly consistent with a Fed that will likely not entertain rate cuts this year. That is a sharp reversal from January, when the consensus called for two rate cuts.
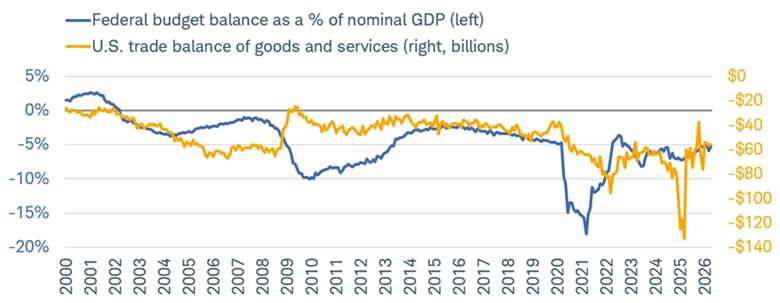
The broader point we made in 2023 holds: the combination of higher economic and inflation volatility, the lessons from the zero-interest rate era, and surging government debt all mean monetary and fiscal policymakers have less flexibility than they did during the Great Moderation Era. This especially rings true in the U.S. economy, which continues to run "twin deficits" (the fiscal and current accounts), albeit with the U.S. dollar maintaining its status as the world's reserve currency.
U.S. running "twin deficits"
Source: Charles Schwab, Bloomberg, as of 4/30/2026.
This is all in keeping with our exploration of the tenets of neoliberalism's retreat, which looked cyclical in 2023 but is appearing more structural now. Governments around the world and across the political spectrum are running large deficits while their economies are at or near full employment. Industrial policy—subsidies, domestic content requirements, reshoring incentives, etc.—is no longer a fringe idea, but (at times) a bipartisan framework. Per Bloomberg news, price controls have been attempted in response to the various supply shocks over the past few years. From pharmaceuticals in the United States to rice in the Philippines, developed and emerging economies have explored ways to combat shortages and price spikes. Trade policy has moved from rules-based multilateralism toward managed bilateralism, and central bank independence has come increasingly under the microscope, facing heightened political pressure.
What might this mean for investments?
Our conviction has been (and still is) that a new version of the Temperamental Era is not a bad one that lacks opportunities for investors—it's just a different environment than what's faced investors over the past quarter century. We continue to believe factor- and characteristic-based investing may suit investors well in a world of greater return dispersion. To expand:
- Inflation volatility, not price level, is the key variable. Tariff shocks, the Iran war, and the AI infrastructure buildout have reinforced our view that the greater risk might not be a permanently higher inflation plateau, but rather repeated, sharp, supply-driven spikes separated by disinflationary interludes. This argues for maintaining flexibility in duration positioning and being tactical when it comes to stocks that have cash flows pushed out further into the future.
- The correlation between stocks and bond yields has been volatile and mostly negative in the post-pandemic era—meaning bonds have provided less diversification as yields go up for the so-called wrong reason (inflation) as opposed to the right reason (growth).
- A unique feature of the Temperamental Era is the dominance of mega caps in various indexes. With the 10 largest members in the S&P 500 making up north of 40% of the index's market cap, according to Bloomberg, sharp moves in a slim number of stocks can determine index moves. Put another way, 10 stocks can be doing one thing, but "the market" may look completely different. This argues for more discernment when it comes to active management of individual names and industries.
- Geopolitical risk is not to be ignored when it comes to commodity shortages and shocks. The effective closure of the Strait of Hormuz sharply reversed the rest-of-world versus the U.S. trade tensions that began earlier this year—almost chiefly due to the notion that certain countries in Asia and Europe were bound to face physical energy shortages, while the U.S.'s issues were mostly confined to higher prices (not that those don't matter to consumers). Relatively speaking, U.S. growth prospects held up much better.
- The "Fed put" is conditional and might not function as investors have long assumed. Those accustomed to a central bank backstop should have open minds given inflation has been above the Fed's target for five-plus years, AI's productivity gains have yet to show meaningful downward pressure on inflation, and higher tariffs are likely here to stay.
In sum
With the Great Moderation Era firmly in the rearview mirror, the question moving forward is how long the new Temperamental Era will last, how it will differ from the one in the 1960s through the 1990s, and whether AI-driven productivity will eventually help offset the inflationary impacts from negative supply shocks over the past several years.
We remain constructive and open-minded regarding the opportunity set that investors have in this new era, but we also encourage folks to be realistic when it comes to how different the backdrop will likely look. More frequent bouts of inflation volatility, tougher trade-offs for policymakers, and greater dispersion in equity market returns are among the dynamics that favor diversification and factor-based investing. We do not see stock and bond yield correlations durably flipping back to positive territory soon, which means inflation will likely continue to be a dominant driver of market behavior.