Good Times Bad Times: 2025's Leadership Shifts

The bull charges on amid an uneven news flow. Perhaps the move by U.S. stocks off the early-April lows is emblematic of the age-old adage about bull markets often climbing a "wall of worry." As shown below, year-to-date gains are subdued, but nonetheless positive. However, since the April 8th closing low for the S&P 500, all major U.S. indexes are up by hefty double-digit percentages. Per the index maximum drawdown column, the route to the April 8th closing low from the prior high on February 19th was not fun. The Nasdaq and Russell 2000 indexes hit bear market level declines (defined as a peak-to-trough drop of at least 20%), while the S&P 500 was saved from the same fate courtesy of the epic reversal day on April 9th (during that day's intraday low, the S&P 500 had dropped into bear market territory).
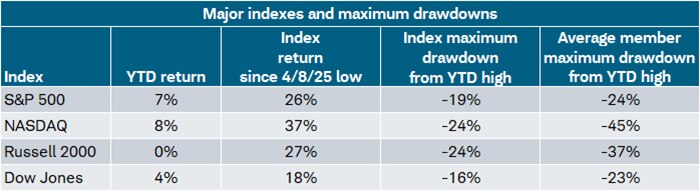
Source: Charles Schwab, Bloomberg, as of 7/18/2025.
Some members excluded from year-to-date return columns given additions to indices were after January 2025. Indexes are unmanaged, do not incur management fees, costs and expenses and cannot be invested in directly. Past performance is no guarantee of future results.
As shown in the far-right column above, at the average member level, a different story is told, especially for the Nasdaq. At the index level, the S&P 500 was down 19% at its low point, while at the average member level, the maximum drawdown has been -24%. In the case of the Nasdaq, it was down 24% at its low point, while at the average member level, the maximum drawdown has been a much more severe -45%.
Style tips
It's interesting to break this year down into its three distinct phases: year-to-date, between the prior high on February 19th and the closing low on April 8th, and since April 8th; highlighted in the S&P 500 chart below.
Market's tale of three phases
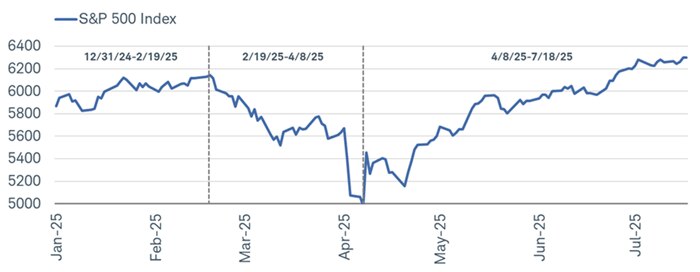
Source: Charles Schwab, Bloomberg, as of 7/18/2025.
Indexes are unmanaged, do not incur management fees, costs and expenses and cannot be invested in directly. Past performance is no guarantee of future results.
What a difference a phase makes. As shown in the table below, between February 19th and April 8th, growth indexes had bear market level declines of more than -20%, with large cap value faring better. Since then, growth indexes have soared, with value indexes lagging behind—especially large cap value.
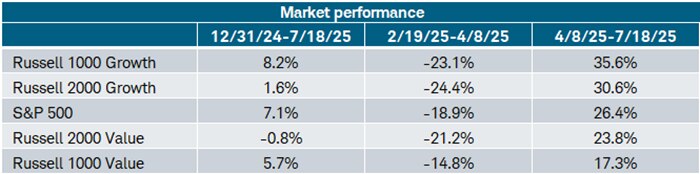
Source: Charles Schwab, Bloomberg, as of 7/18/2025.
Indexes are unmanaged, do not incur management fees, costs and expenses and cannot be invested in directly. Past performance is no guarantee of future results.
Sector swings
Another place to observe dramatic shifts in performance from phase to phase is at the sector level. As shown below, the "growth trio" of sectors—Technology, Communication Services, and Consumer Discretionary—all had bear market level declines between February 19th and April 8th. Technology has had the most impressive rebound, not far from a 50% gain off the low, but not enough to bring its year-to-date performance into the lead. That place is now held by the Industrials sector.
We continue to have a sector neutral sector recommendation in light of not only these dramatic shifts in performance, but also due to extreme policy-related instability, especially on the tariff front. Once at least some of that policy-related uncertainty eases, we will shift back to providing outperform and underperform sector recommendations.
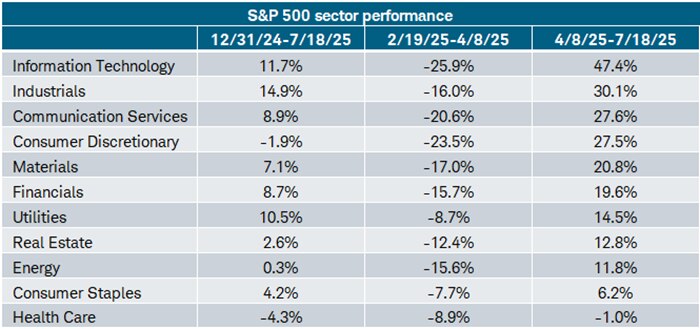
Source: Charles Schwab, Bloomberg, as of 7/18/2025.
Sectors are based on the Global Industry Classification Standard (GICS®), an industry analysis framework developed by MSCI and S&P Dow Jones Indices to provide investors with consistent industry definitions. Past performance is no guarantee of future results.
Disciplines
These dramatic style and sector shifts emphasize the benefits of disciplines around diversification—both among and within asset classes—and periodic rebalancing. We have been recommending, for investors with the flexibility, to consider portfolio- (or volatility-) based rebalancing vs. calendar-based rebalancing. What is perhaps most interesting about areas of strength and weakness at the sector level since the April 8th closing low is the cyclical bias of the sectors in the lead. The stock market has been sending a clear message about economic resilience. So far, so good; but the full story is more nuanced.
Not without budding risks
This year's maximum drawdown, rebound, and overall move higher have all had some markings of speculative fervor. As shown in the chart below, the biggest swings have been in the riskiest corners of the market—not least being heavily shorted stocks, non-profitable tech stocks, and companies most favored by retail traders. From the February 19th peak to the S&P 500's April 8th low, those segments of the market experienced severe drawdowns—all worse than the S&P 500. Conversely, defensives and bond proxies outperformed, barely registering any meaningful losses (fulfilling their intended purpose during corrections and bear markets).
However, the subsequent rebounds for the speculative baskets have been equally extreme, with non-profitable tech stocks leading the way. Their rally has been strong enough to push their year-to-date gains far above the S&P 500's. The magnitude of these moves is looking similar to the early days of the 2020-2021 bull market, during which speculation was running rampant and risky, arcane parts of the market were gaining significant ground relative to the S&P 500.
Risky is all the rage this year
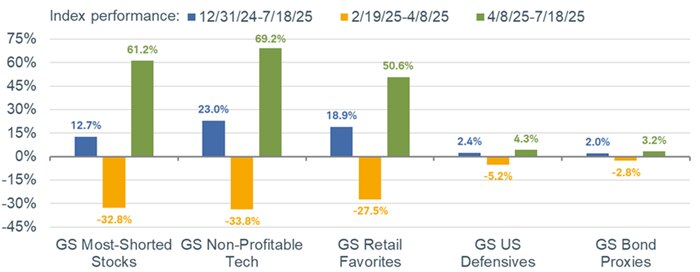
Source: Charles Schwab, Bloomberg, as of 7/18/2025.
Goldman Sachs (GS) Most-Shorted basket contains the 50 highest short interest names in the Russell 3000 with a market cap greater than $1 billion. GS Non-Profitable Technology basket consists of non-profitable U.S.-listed companies in innovative industries. Technology is defined quite broadly to include new economy companies across GICS industry groupings. GS Retail Favorites basket consists of U.S. listed equities that are popularly traded on retail brokerage platforms. GS US Defensives basket contains equities with a beta to US GDP growth lower than the S&P 500's beta excluding commodity input cost and other equities impacted by macro environment. GS Bond Proxies basket contains US equities that have bond like characteristics. Indexes are unmanaged, do not incur management fees, costs and expenses and cannot be invested in directly. Past performance does not guarantee future results.
That isn't entirely comforting given the fact that said bull market was short-lived. However, using that cycle as a guide is not entirely helpful for a host of reasons—not least being the different economic backdrop in which we find ourselves. We'd have to see further, significant gains from here and a meaningful deterioration in breadth for a 2022-like repeat to occur; not to mention the fact that 2022's bear market was reflective of the COVID-19-related surge in inflation and the Federal Reserve's aggressive tightening campaign.
As of now, breadth is holding up and, if anything, improving. As shown in the chart below, the percentage of S&P 500 stocks in a bear market has been declining sharply. By early April, the count spiked to a level consistent with prior corrections and bear markets; it's still above 20% but has been trending in the right direction. This isn't to say that the market's ascent doesn't face upcoming challenges; but for now, the trend for most names in the S&P 500 is indicative of a healthier backdrop.
Bears going into hiding
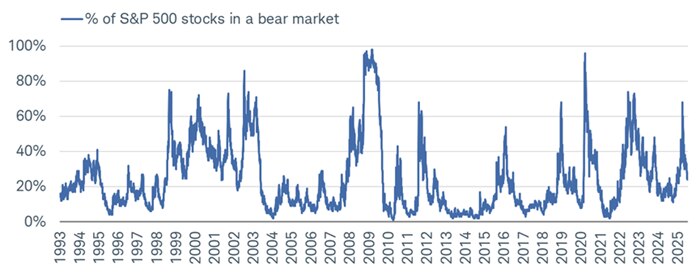
Source: Charles Schwab, SentimenTrader, as of 7/18/2025.
The percentage of S&P 500 stocks in a bear market, is commonly defined as being at least 20% below their 52-week high.
In sum
There is no shortage of things to worry about; but that's the wall markets often climb. Broad leadership—especially among cyclical segments of the market—suggests a resilient economy, but policy-related instability remains a risk. Narrower leadership shows retail traders are dominating market action but be mindful of the lower-quality nature to what's been outperforming. We continue to recommend staying up in quality, alongside maintaining traditional disciplines around diversification and periodic rebalancing.