Fixed Income: Frequently Asked Questions

Fixed income securities have been buffeted this year by events including rising federal debt, a resumption of Federal Reserve rate cuts, a lack of data given the government shutdown, and some headline-grabbing corporate defaults. Fixed income investors wary of continued volatility have asked us many questions. Here we address a few of the currently most frequently asked questions (FAQs) about fixed income investments, including market conditions, credit quality and other issues that can affect debt securities.
1. Federal Reserve Chair Jerome Powell has said that the federal debt is "on an unsustainable path." What does that mean for the U.S. Treasury market?
An unsustainable path refers to a case when debt grows faster than the economy, and our debt and deficit data don't paint a rosy picture. The U.S. is running a deficit of 5.8% of gross domestic product (GDP) and our ratio of debt to GDP has hit 124%.
Historically there has been no correlation between the size of the deficit or its growth rate and bond yields. It's counterintuitive—because when deficits run large, the Treasury issues more bonds, increasing the supply. It would seem logical that yields would rise to attract buyers. However, that hasn't been the case in the past. With the U.S. dollar as the world's reserve currency, demand for U.S. Treasuries is quite strong and issuance has been absorbed without a discernible rise in yields. Moreover, the U.S. is a large economy and a wealthy country capable of servicing the debt.
Nonetheless, we are concerned that the size of the debt load is reaching a point that might cause investors to pause—or demand more yield in order to invest in long-term Treasuries. The dysfunction in Washington and signals that Congress is not willing to address deficit spending could mean that demand for long-term Treasuries softens. The result would likely be a rise in the term premium—the extra yield that investors demand to hold long-term bonds versus a series of short-term bonds.
The term premium for 10-year Treasuries has been rising over the past few years after falling into negative territory in the years leading up to the pandemic. At about 60 basis points (or 0.60%) it is not as high as it was in the past. Consequently, it wouldn't be surprising to see 10-year Treasury yields rise due to an increase in the term premium, even if the Fed cuts short-term interest rates. All else being equal, a rising term premium could add 40-50 basis points to 10-year yields from current levels, as its average since 1990 is just over 100 basis points.
The 10-year Treasury "term premium" has risen lately but is well below previous highs

Source: Bloomberg. Adrian Crump & Moench 10-year Treasury Term Premium (ACMTP10 Index). Daily data from 11/12/2010 to 11/12/2025.
Indexes are unmanaged, do not incur fees or expenses, and cannot be invested in directly. Past performance is no guarantee of future results.
The term premium is the compensation that investors require for bearing the risk that short-term Treasury yields do not evolve as they expected. The term premium in the chart above is obtained from a statistical model developed by New York Federal Reserve Bank economists Tobias Adrian, Richard K. Crump, and Emanuel Moench.
2. What is the outlook for the Federal Reserve?
We expect the Fed to keep the federal funds rate steady at the December meeting due to ongoing concerns about inflation and uncertainty about the economy due to lack of data. The fed funds futures market is discounting a significant drop in the fed funds rate into 2026, but we see a slower and shallower path for rates to move lower.
At the last Federal Reserve Open Market Committee (FOMC) meeting, Powell indicated that a rate cut in December was "far from certain." Since then at least four members of the committee have indicated that they are not on board with another rate cut this year due to concerns about inflation. Using the consumer price index (CPI) as a measure, inflation has been holding near 3% for several months and has recently started to move up.
Inflation is sticky
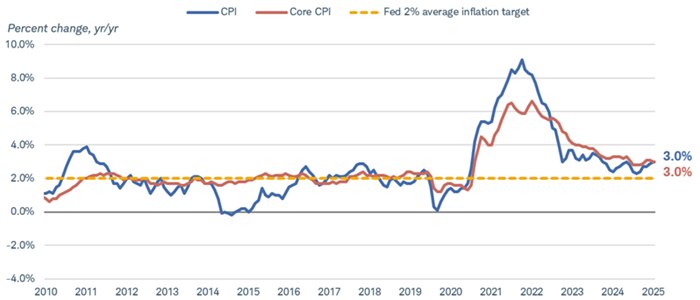
Source: Bloomberg. Monthly data from 9/30/2010 to 9/30/2025, which is the latest available data.
Consumer Price Index for All Urban Consumers: All Items Less Food & Energy (CPI XYOY Index) and Consumer Price Index for All Urban Consumers: All Items (CPI YOY Index).
Meanwhile, the labor market has shown signs of softening with job growth slowing, which led to the Fed's recent rate cuts. However, the unemployment rate remains low at under 4.5%, which is still consistent with "full employment."
3. What's the outlook for the dollar?
Lack of hard economic data due to the government shutdown from October 1st to November 12th is another reason for the Fed to move slowly on rate cuts. It will take a month or two for the labor market and inflation statistics to get updated. The data void could add to the Fed's caution. Moreover, the Fed has only a limited amount of room to cut rates until there is evidence that inflation is headed lower. The lower bound of the target range for the fed funds rate is 3.75% which is only 75 basis points above the current inflation rate. If the Fed moved quickly to slash short-term rates, it would risk pushing real short-term interest rates into negative territory, which would be stimulative.
As we look into 2026, we expect that growth and inflation will likely slow, allowing the Fed to cut rates modestly. However, the path is likely to be slow and cautious.
4. What's the outlook for the muni market?
Over time we expect the dollar to resume its decline. After falling more than 10% from its January 2025 high, the Bloomberg Dollar Spot Index has generally held in a tight range since July. That decline was likely driven by weaker U.S. growth prospects in light of the tariff announcements, but the recent resiliency of the U.S. economy appears to have stalled that decline.
The dollar often follows the path of U.S. interest rates. When U.S. yields rise relative to other government bond yields, the dollar tends to follow, and vice versa. The gap between the average yield of the Bloomberg US Aggregate Index and the Bloomberg Global Aggregate ex-USD Index has declined lately, and monetary policies appear to be diverging. The Federal Reserve lowered its benchmark interest rate again at its October meeting, and although the outlook around the timing and number of rate cuts is uncertain, it seems likely that the Fed will cut rates a couple more times over the next few quarters. The European Central Bank is likely done cutting rates for the time being, however, after lowering its policy rate by 200 basis points from June 2024 through June 2025. Meanwhile, the Bank of Japan has gradually raised rates after holding its policy rate below zero from 2016 through early 2024. As the Fed gradually cuts rates, interest differentials should continue to decline.
The unemployment rate is still low
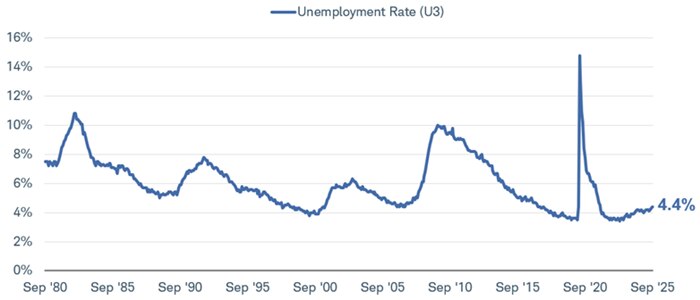
Source: Bloomberg. Monthly data from 8/31/1980 through 9/30/2025, which is the latest available data.
U-3 US Unemployment Rate Total in Labor Force Seasonally Adjusted (USURTOT Index). The U-3 unemployment rate is the official unemployment rate, which measures jobless people who are actively looking for work as a percentage of the civilian labor force. It is the most commonly cited unemployment statistic in the news and is often lower than other measures like U-6 because it excludes underemployed and discouraged workers.
The dollar moves in many directions at once, depending on which exchange rate you're referencing, but the euro and the yen make up 42% of the Bloomberg Dollar Spot Index.
As the advantage that U.S. yields currently offer above other developed market bonds offer declines, the dollar looks likely to continue trending lower over the course of the next few quarters, and we expect volatility to remain elevated.
5. Should investors consider mortgage-backed securities?
Usually municipal bonds make sense only for fixed income investors in higher tax brackets but that's not the case today—they also can make sense in some lower tax brackets.
Munis offer an attractive combination of high tax-adjusted yields and strong credit quality in our view. Municipal bonds generally pay interest income that's exempt from federal and potentially state income taxes and partly as a result, their yields are usually less than most other fixed income investments. One method to compare municipal bond yields to other fixed income investments is to look at the tax-equivalent yield. This is essentially the yield on a muni if it were fully taxable. For an investor in the top federal tax bracket of 37% or even a moderate tax bracket of 24%, tax-equivalent yields are very comparable, and even higher, than many other fixed income investments. For example, the yield-to-worst for the Bloomberg Municipal Bond Index is currently about 3.6%. This is the equivalent of a 6% yield for an investor in the top tax bracket (37% plus a 3.8% Net Investment Income Tax) or 4.7% currently for an investor in the 24% tax bracket. Additionally, munis tend to be less volatile than other fixed income investments. Relative to their risk, as measured by standard deviation, we think munis stack up well against other fixed income investments.
The dollar has declined as the spread between U.S. and global yields narrowed

Source: Bloomberg. Weekly data from 11/7/2010 to 11/7/2025.
Bloomberg Dollar Spot Index (BBDXY Index), Bloomberg US Aggregate Index (LBUSTRUU Index), Bloomberg Global Aggregate ex-USD Index (LG38TRUU Index). Indexes are unmanaged, do not incur fees or expenses, and cannot be invested in directly. Past performance is no guarantee of future results.
Within the muni market, we believe there are opportunities with longer-term munis for investors who are comfortable with duration risk. As illustrated in the chart below, relative to Treasuries, the difference in yields is much higher for longer-term munis than shorter-term munis after adjusting for the impact of taxes. We don't believe that most investors should focus the bulk of their fixed income portfolio in longer-term munis because they are more sensitive to interest rates; if rates rise, prices of longer-term bonds will likely fall more than short-term bonds. However, given the differences in yields, we think they can be worth a second look.
Yields for mortgage-backed securities are currently higher than comparable alternatives
We believe that mortgage-backed securities (MBS) can have a place as part of a diversified fixed income portfolio. Mortgage-backed securities are investments that are comprised of pools of mortgages. They generally make regular interest payments that are comprised of both principal and interest. As a result, the principal is slowly paid back to the investor. Like most other fixed income investments, they have a stated maturity date, but unlike most other fixed income investments, the principal is often paid off prior to that date in small increments rather than one lump sum. Partly because of this risk, they often pay a higher rate of interest than comparable investments of similar credit quality. For example, the average yield on an index of Treasury securities is 3.9% compared to 4.7% for an index of mortgage-backed securities.
Munis may offer higher tax-adjusted yields but with less volatility than other fixed income investments
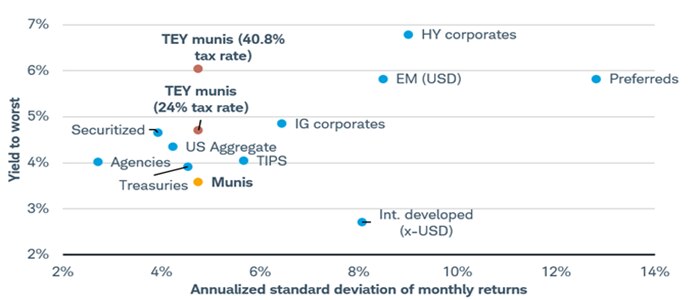
Source: Bloomberg.
Yield to worst as of 11/10/25. Monthly returns from 10/29/2004 to 10/31/2025. Taxable Equivalent Yield (TEY) munis assume a 40.8% federal tax rate and a 24% federal tax rate respectively.
Yield to worst represents the lowest yield a bondholder might receive if the bond is redeemed before maturity while still complying to agreement terms. Indexes representing the investment types are: Preferreds = ICE BofA Fixed Rate Preferred Securities Index; HY Corporates = Bloomberg US High Yield Very Liquid (VLI) Index; IG Corporates = Bloomberg U.S. Corporate Bond Index; US Aggregate = Bloomberg U.S. Aggregate Index; Munis = Bloomberg US Municipal Bond Index; Treasuries = Bloomberg U.S. Treasury Index; EM (USD) = Bloomberg Emerging Markets USD Aggregate Bond Index; Securitized = Bloomberg US Securitized Index; Agencies = Bloomberg U.S. Agency Bond Total Return Index; TIPS = Bloomberg US Treasury Inflation-Protected Securities (TIPS) Index; Int. developed (x-USD) = Bloomberg Global Aggregate ex-USD Bond Index. Indexes are unmanaged, do not incur management fees, costs and expenses, and cannot be invested in directly. Standard deviation is a statistical measure that quantifies the amount of dispersion in a data set. In finance, a higher standard deviation typically means a more volatile security. Past performance is no guarantee of future results.
Adding mortgage-backed securities to a portfolio can help with diversification
Beyond the potential for higher yields, mortgage-backed securities can also help diversify a portfolio. The correlation between mortgage-backed securities and riskier investments, like the S&P 500 in this example, is low. Correlation is a measure of how closely returns move together. A correlation of +1 means the two securities move perfectly with one another while a correlation of -1 means the two securities move in exactly the opposite direction. A lower correlation means greater diversification benefits.
Longer-term munis currently yield more than Treasuries after taxes
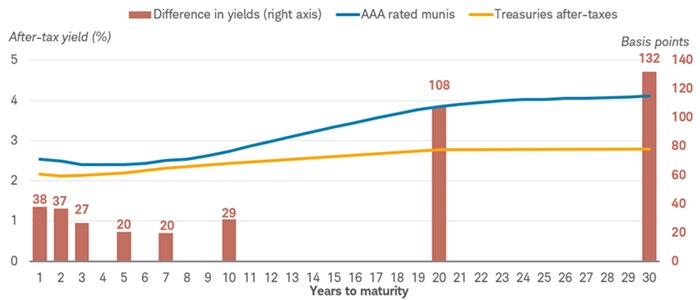
Source: Bloomberg, as of 11/10/2025.
Municipal bonds are represented by the Bloomberg BVAL AAA Muni Curve, Treasuries are represented by the US Treasury Actives Curve. Treasuries assume a 37% tax bracket and 3.8% Net Investment Income Tax. For illustrative purposes only. Past performance is no guarantee of future results.
Although mortgage-backed securities have potential benefits, they're not without risks. Two unique risks with MBS are prepayment risk and extension risk, or the risks that an investor will receive their principal payments earlier (prepayment) or later (extension) than expected. For example, if interest rates fall, mortgage-backed securities generally pay principal sooner than expected and the investor is faced with the prospect of investing the proceeds in a lower yielding environment. The opposite is true if rates rise. In this instance, generally mortgage-backed securities pay principal later than expected and investors miss out on the opportunity to invest in a higher yielding environment.
We believe that agency mortgage-backed securities should be considered as part of a fixed income portfolio's "core holdings." We generally suggest no more than 20% of the fixed income allocation be dedicated to mortgage-backed securities but that can vary based on investor preferences and risk tolerance. Additionally, investors may want to consider using a fund, like a mutual fund or ETF, because reinvesting principal and interest payments with individual mortgage-backed securities can be difficult. You should consult the fund's prospectus to understand its investment objectives, risks, charges, and expenses.
1 Source: Congressional Budget Office, "Information Concerning the Budgetary Effects of H.R. 1, as Passed by the Senate on July 1, 2025," July 1, 2025.