Alternative Candidate(s) for Data During Shutdown
With key federal government agencies shuttered and official data releases suspended, investors have been turning to alternative private sector data sources to track real-time economic conditions during the shutdown. We are highlighting key sources in this week's report which are helping to fill the informational void left by delayed reports such as the Employment Situation (monthly jobs report), construction spending, the trade balance, and retail sales.
Below, we show how much longer that list might be if the shutdown lasts through the end of this week. Worth noting is that the Bureau of Labor Statistics (BLS) is calling back employees to put out the September Consumer Price Index (CPI) report, which is now slated for release on October 24th.
Economic reports delayed by government shutdown
- Report
- Period
- Source
- Original release date*
-
ReportConstruction spendingPeriodAugustSourceCensus BureauOriginal release date*10/1/2025
-
ReportInitial jobless claimsPeriodWeek ended 9/27/2025SourceDepartment of LaborOriginal release date*10/2/2025
-
ReportFactory ordersPeriodAugustSourceCensus BureauOriginal release date*10/2/2025
-
ReportNonfarm payrollsPeriodSeptemberSourceBureau of Labor StatisticsOriginal release date*10/3/2025
-
ReportTrade balancePeriodAugustSourceBureau of Economic ResearchOriginal release date*10/7/2025
-
ReportInitial jobless claimsPeriodWeek ended 10/4/2025SourceDepartment of LaborOriginal release date*10/9/2025
-
ReportWholesale tradePeriodAugustSourceCensus BureauOriginal release date*10/9/2025
-
ReportFederal budget balancePeriodSeptemberSourceTreasury DepartmentOriginal release date*10/10/2025
-
ReportCPIPeriodSeptemberSourceBureau of Labor StatisticsOriginal release date*10/15/2025?
-
ReportReal average earningsPeriodSeptemberSourceBureau of Labor StatisticsOriginal release date*10/15/2025?
-
ReportRetail salesPeriodSeptemberSourceCensus BureauOriginal release date*10/16/2025?
-
ReportPPIPeriodSeptemberSourceBureau of Labor StatisticsOriginal release date*10/16/2025?
-
ReportInitial jobless claimsPeriodWeek ended 10/11/2025SourceDepartment of LaborOriginal release date*10/16/2025?
-
ReportBusiness inventoriesPeriodAugustSourceCensus BureauOriginal release date*10/16/2025?
-
ReportHousing starts/building permitsPeriodSeptemberSourceCensus BureauOriginal release date*10/17/2025?
-
ReportImport/export pricesPeriodSeptemberSourceBureau of Labor StatisticsOriginal release date*10/17/2025?
-
ReportU.S. foreign net transactionsPeriodAugustSourceTreasury DepartmentOriginal release date*10/17/2025?
U.S. government data are the gold standard in terms of depth and breadth. The collection efforts and capabilities of the Bureau of Economic Analysis (BEA), BLS, and others are second to none, so it's understandable that with these agencies closed, markets and investors are presumably flying blind. While we wait in the (federal) dark, the best we can do is sift through data from the private sector—many of which we'll go over briefly in this report.
What say you, labor data?
Catching most investors' attention in the past couple weeks was the employment report put out by ADP, which tracks private sector job growth. As shown in the chart below, ADP reported a decline of 32,000 jobs in September, which was much worse than August's decline of 3,000. That drop was revised from an initially reported gain of 54,000–meaning the labor picture was much worse than expected heading into September.
ADP payrolls contracting
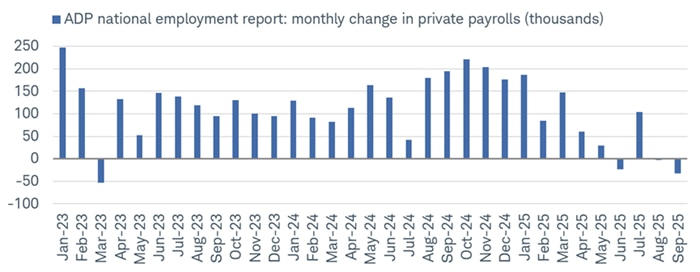
Source: Charles Schwab, ADP Research, Bloomberg, as of 9/30/2025.
Conversely, however, a report from Revelio Labs—which uses data from 100+ million U.S. job profiles and follows a similar format to the BLS in tracking labor data—showed that the economy added 60,000 jobs in September. That's in stark contrast to ADP's report, but keep in mind that both sources' trends were also quite different last year, with Revelio understating the degree of strength in both ADP jobs as well as payrolls reported by the BLS.
Revelio says no pain, strong gains
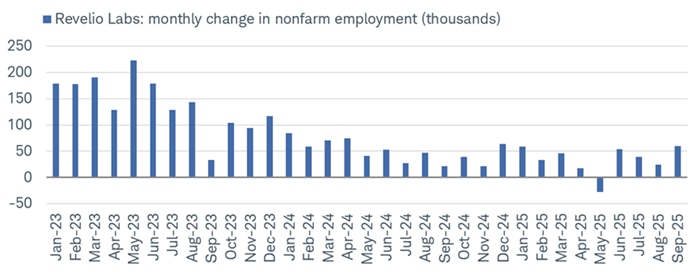
Source: Charles Schwab, Bloomberg, Revelio Public Labor Statistics (RPLS), as of 9/30/2025.
In keeping with the labor theme of low layoff activity, job cut announcements tracked by Challenger, Gray, and Christmas have rolled back over; the year-over-year change fell further into negative territory in September.
Layoff announcements falling
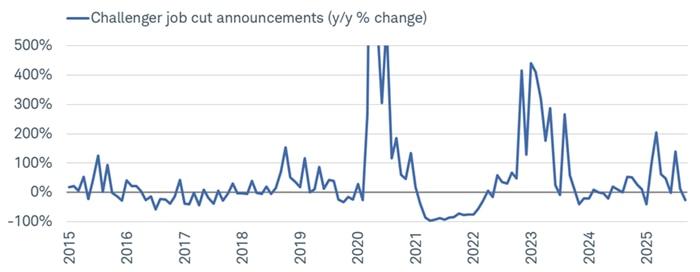
Source: Charles Schwab, Bloomberg, as of 9/30/2025. Y-axis truncated for visual purposes.
In keeping with the other labor theme of low hiring activity, Indeed's Job Posting Index has also continued to decline, suggesting a continued downtrend for the BLS' Job Opening and Labor Turnover Survey (JOLTS).
Indeed, there is less labor demand
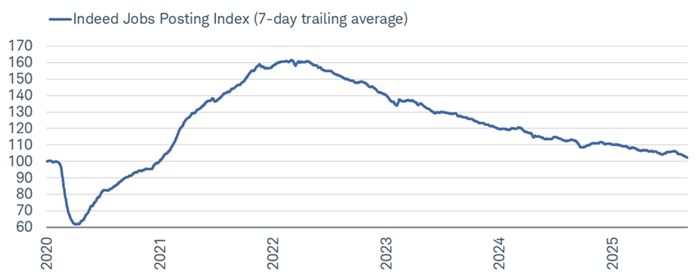
Source: Charles Schwab, Federal Reserve Bank of St. Louis (fred.stlouisfed.org), Indeed, as of 10/3/2025.
Indeed Job Posting Index calculates the change in level of job postings since 2/1/2020 (pre pandemic baseline), using a 7-day trailing average. Data indexed to 100 (base value=2/1/2020). An index number is a figure reflecting price or quantity compared with a base value. The base value always has an index number of 100.
At the small business level, however, there is a different trend in place. Per the National Federation of Independent Businesses (NFIB), hiring plans have picked up over the past few months. Worth noting is that the level is not particularly strong, so the recent rebound isn't suggestive of a major hiring boom on the horizon.
Small business hiring plans improving
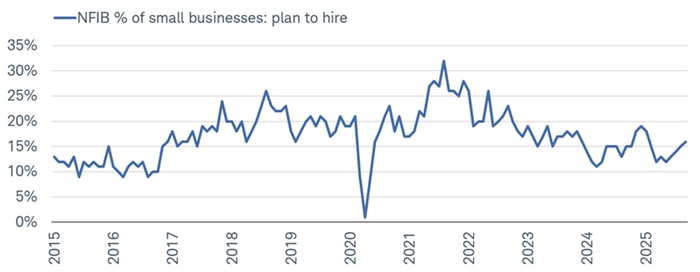
Source: Charles Schwab, Bloomberg, National Federation of Independent Business (NFIB), as of 9/30/2025.
That provides a bit of a contrast to the recent pickup in news stories mentioning job cuts, firings, or layoffs per Bloomberg news. The uptick wasn't as aggressive as what was seen in the first quarter of this year, and as shown below, it has rolled over again; although if federal layoffs persist, this could hook higher again.
An improving "story"
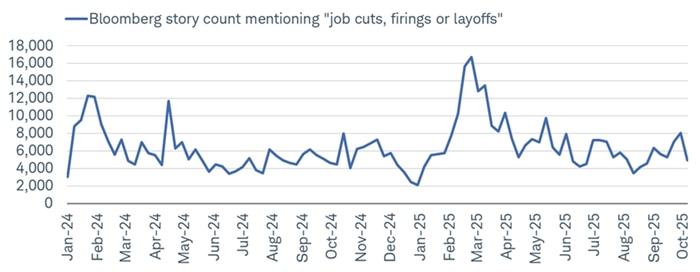
Source: Charles Schwab, Arbor Research & Trading LLC, Bloomberg, as of 10/10/2025.
One benefit of the Federal Reserve banks being separate from the federal government is that they don't cease operations during shutdowns. As such, we have employment statistics from the five key regional Fed banks, which provide their own manufacturing reports each month. As shown below, three of the five show employment being in contraction in September, with Richmond in the weakest spot.
Fed banks reporting labor weakness
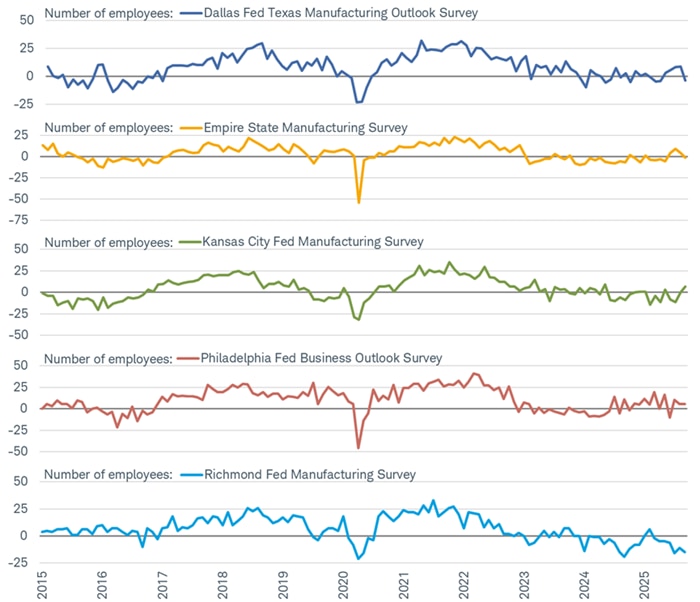
Source: Charles Schwab, Bloomberg, Federal Reserve Banks of Dallas, New York, Kansas City, Philadelphia and Richmond, as of 9/30/2025.
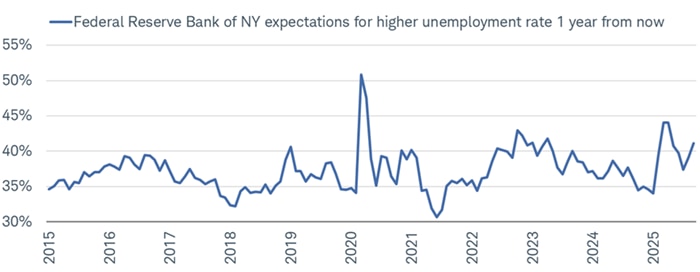
In a separate report put out by the New York Fed, consumers' expectations for higher unemployment a year from now has started to pick up rather sharply. As shown below, there was a nice rolling over earlier this year, but that has started to reverse.
NY Fed says labor concerns rising…
Source: Charles Schwab, Bloomberg, as of 9/30/2025.
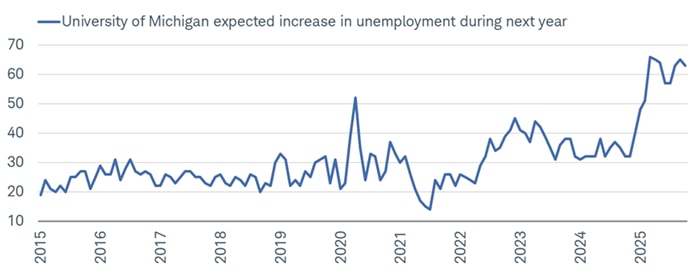
That is consistent with, but not as bad as, a similar datapoint put out by the University of Michigan (UMich) in its Consumer Sentiment Index. Expectations for higher unemployment are near a cycle high, shown below.
…and so does UMich
Source: Charles Schwab, Bloomberg, as of 10/10/2025.
Inflation and growth concerns justified?
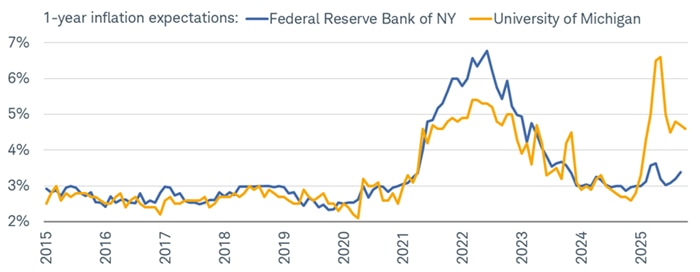
As mentioned, we are expecting to see a CPI report toward the end of the month, but for now, we can take a look at a few supplemental datapoints that show still-sticky inflation expectations. For September, the New York Fed's consumer survey showed an uptick in year-ahead inflation expectations. UMich's series ticked down a little but remains considerably high.
Price concerns still elevated
Source: Charles Schwab, Bloomberg.
Federal Reserve Bank of NY as of 9/30/2025. University of Michigan as of 10/10/2025. Chart plots median inflation expectations.
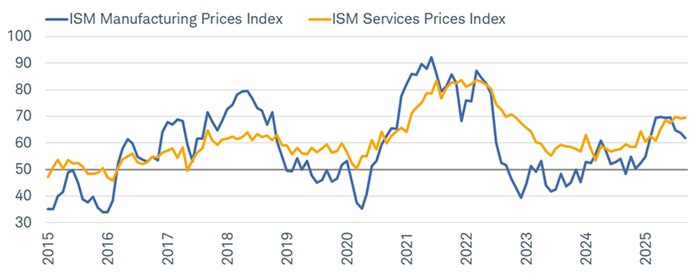
On the business side, the picture is a bit mixed when splitting the economy into manufacturing and services. As shown below, the Purchasing Manager Indexes (PMIs) from the Institute for Supply Management (ISM) underscore stickier price pressures for services, but some easing for manufacturing.
Stickier services prices per ISM
Source: Charles Schwab, Bloomberg, Institute for Supply Management (ISM), as of 9/30/2025.
None of those inflation concerns have derailed consumer spending, however. The Johnson Redbook Index, which tracks same-store retail sales on a weekly basis, has been firmly in positive year-over-year territory for the better part of the past two years.
Redbook sales not in the red
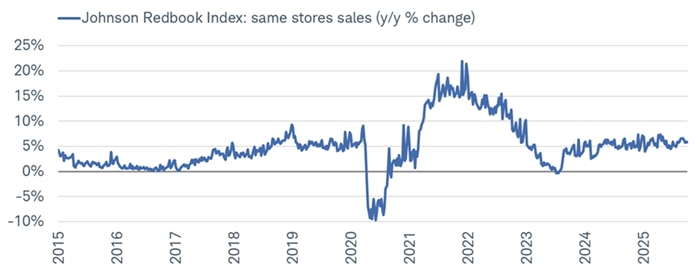
Source: Charles Schwab, Bloomberg, as of 10/4/2025.
In sum
While less standardized and occasionally more volatile, the datasets above, among others, can offer valuable high-frequency insights into labor demand, inflation, and consumer behavior. While we wait for the government to re-open, these alternate data sources can serve as an essential bridge for economic monitoring until normal statistical reporting resumes. Beyond that, it would not surprise us if these alternative data sources remain popular monitors alongside government-issued releases, given recently elevated concerns about government data efficacy and low response rates to a wide number of survey-based data points.