You’ve Got to Earn It: Earnings Growth Strong, But Descending

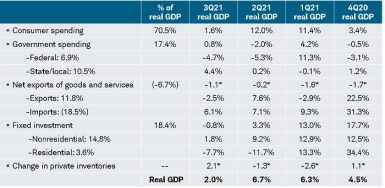
The third quarter is in the books, but not yet with the final readings for either the economy broadly, or corporate earnings specifically. The first read on third quarter real gross domestic product (GDP) was released on Friday, and it was a disappointment relative to expectations—driven in large part by ongoing global supply chain bottlenecks and labor shortages. The details of GDP are in the table below. The 2% gain (quarter-over-quarter at an annualized rate) was less than the consensus estimate of 2.6%; and well below estimates that were as high as 7% at the start of the quarter.
Source: Charles Schwab, Bureau of Economic Analysis, as of 9/30/2021. *Represents contribution to percent change in real GDP. Numbers may not add up to 100% due to rounding. Real GDP based on annualized Q/Q % change.
A theme of my recent reports and videos has been the shift from an age of abundance to an age of scarcity. Shortages of myriad varieties, including labor and semiconductors, are likely to be persistent and carry well into next year; suggesting a significant rebound in the big GDP driver of consumption is not in the cards. In the meantime, weaker-than-expected GDP growth in the third quarter was not matched by weaker-than-expected S&P 500 earnings growth.
Another stellar, but slower, quarter
Third quarter earnings season is in its latter innings and so far, so good. Using Refinitiv data, the “blended” expected year-over-year growth rate for S&P 500 earnings is nearing 40%. (Blended refers to the combination of actual earnings for companies that have already reported and consensus estimates for companies yet to report.) Excluding the Energy sector, the blended expected growth rate is 31%. As of Friday, about 280 companies have reported earnings, with more than 82% beating estimates; which compares to a long-term average of less than 66% and a prior four quarter average of nearly 85%.
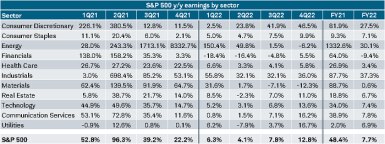
As shown in the table below, even if earnings growth accelerates from here as more companies report, there is no chance the growth rate will exceed second quarter’s 96% (bottom row). Growth is expected to continue its deceleration into the first half of next year. From a sector perspective, Energy is clearly the top earnings driver—driven by the “base effects” relative to last year’s pandemic/lockdown era when oil prices briefly fell into negative territory. Aside from Energy, the highly-cyclical Materials and Industrials sectors top the rankings, with the defensive Utilities and Consumer Staples sectors bringing up the rear.
Source: Charles Schwab, I/B/E/S data from Refinitiv, as of 10/29/2021.
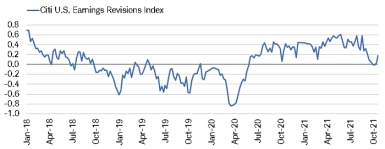
The past year-and-a-half has been characterized by analysts consistently setting the earnings growth expectations bar too low. Since the end of the summer, however, the earnings revisions index has lost steam. The latest uptick is encouraging, but as third quarter earnings season starts to wind down, keeping an eye on this index as the market looks ahead to fourth quarter earnings is essential.
Earnings Revisions Off Peak
Source: Charles Schwab, Bloomberg, as of 10/22/2021. Revisions index measures the number of equity analyst revisions upgrades (positive) and downgrades (negative).
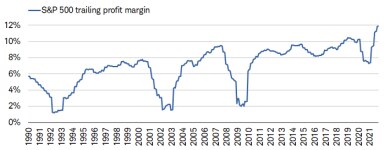
Given the aforementioned supply chain bottlenecks that continue to wreak havoc on economic and inflation data, the profit margin (PM) picture remains bright, as shown below. The recent slight rollover bears watching though. For now, although most sectors have overall positive sentiment readings toward PM results (current data) and PM commentary (forward looking commentary), it’s mostly among cyclical companies. My friend Dennis Debusschere of 22V Research, tracks S&P earnings call commentary; and cyclical company PM commentary sentiment is close to a record high relative to defensive company PM commentary.
Profit Margins’ Spike Unlikely to Persist
Source: Charles Schwab, Bloomberg, as of 10/29/2021.
Supply chain sentiment, as per 22V Research, has dropped significantly this year, while pricing sentiment has skyrocketed to its highest level since 2003. Supply chain issues and pricing pressures are pushing earnings factors and financial sentiment lower.
Valuations better, but still stretched
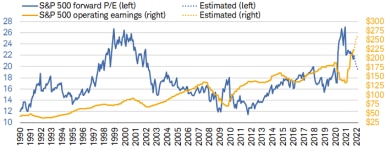
When the forward P/E for the S&P 500 hit ~27 late-last year, it elicited a surge in questions during my virtual client events about whether we were looking at a repeat of the 2000 peak? As shown below, the P/E spike did look eerily similar to the 1999-2000 period, what was decidedly different was the action in the E (earnings). What caused the spike in the P/E in this cycle, was the epic implosion in the E last year. The equally-epic rebound in the E this year brought the P/E down to less than 22, as shown in the chart below. The dotted lines represent the expected trajectory of earnings growth and the related change in the P/E, all else equal (admittedly, a silly expectation when it comes to markets, but illustrative nonetheless).
E Up, P/E Down
Source: Charles Schwab, Bloomberg, as of 10/29/2021. Forecasts contained herein are for illustrative purposes only, may be based upon proprietary research and are developed through analysis of historical public data.
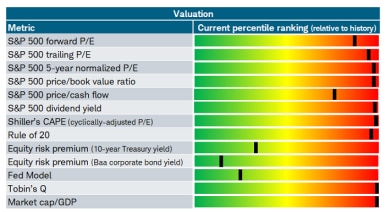
Although the forward P/E has retreated along with the surge in earnings, relative to history, it remains in the expensive zone. In fact, as shown in our popular valuation “heat map” below, most valuation metrics are in the red zone; with the exception of those which look at equity market valuation in the context of the bond market and/or interest rates.
Source: Charles Schwab, Bloomberg, The Leuthold Group, as of 10/29/2021. Due to data limitations, start dates for each metric vary and are as follows: CAPE: 1900; Dividend yield: 1928; Normalized P/E: 1946; Market cap/GDP, Tobin’s Q: 1952; Trailing P/E: 1960; Fed Model: 1965; Equity risk premium, forward P/E, price/book, price/cash flow, rule of 20: 1990. Percentile ranking is shown from lowest in green to highest in red. A higher percentage indicates a higher rank/valuation relative to history.
Sentiment indicator?
Any time I discuss valuation, I alert investors to the simple fact that it’s a terrible market timing tool—especially for time horizons of a year or less. There is no discernible relationship between any valuation’s level and subsequent one-year equity market performance; although there is a much closer relationship when expanding the time horizon to 10 years. In addition, investors typically think of valuation as fundamental and/or quantifiable. But the reality is that valuation (of any variety) is perhaps more of a sentiment indicator—or perhaps better put, an indicator of sentiment.
For now, earnings growth and PMs remain healthy; but with revisions well off their high, and PMs unlikely to rise at as fast a clip as previously, the fourth quarter may represent a turning point. For stock pickers, focus on companies with positive earnings revisions. From a macro perspective, keep a close eye on economic and inflation data between now and year-end. In particular, focus more on month-over-month changes; which eliminate some of the funkiness of the ongoing base effects associated with year-over-year changes.
