Weekly Trader’s Outlook
Fed minutes spook equities and treasury markets; payrolls disappoint.
Follow me on Twitter @RandyAFrederick. I’ll tweet interesting observations about volatility, put/call ratios, technical signals, economics, option block trades and other unusual activity.
Weekly Market Review:
Earnings Summary
While the regular Q4 earnings season doesn’t begin to ramp up for about another week, this week, 4 S&P 500 companies reported Q4 earnings and 3 of them beat consensus EPS expectations. A detailed earnings calendar can be found by logging into Schwab.com and selecting Research>Calendar>Earnings.
Overall, 21 (4%) of the companies in the S&P 500 have reported Q4 results. Below are the aggregate beat rates relative to the final results from recent quarters. Don’t extrapolate these results yet as it is still very early in the earnings season.
Quarter EPS beats Rev beats
Q4 ’21 80% 80%
Q3 ‘21 82% 68%
Q2 ‘21 86% 83%
Q1 ‘21 87% 72%
Q4 ’20 78% 69%
Q3 ‘20 84% 74%
Q2 ‘20 85% 65%
Q1 ‘20 65% 59%
Q4 ’19 74% 64%
Q3 ‘19 78% 58%
Q2 ‘19 76% 56%
Q1 ‘19 77% 57%
Q4 ’18 73% 60%
Q3 ’18 82% 61%
Q2 ‘18 84% 72%
Q1 ‘18 81% 74%
Average 79% 66%
From a growth standpoint, Q4 earnings are +22.7% y/o/y so far versus the +21% estimate when the quarter ended. Q4 revenue is +12.8% y/o/y so far versus the +13% estimate when the quarter ended. This compares to actual growth of +39.1% and +17.4% respectively in all of Q3.
Economics Recap
Better (or higher) than expected:
- ADP Employment Change for Dec: +807k vs. +410k est
- Trade Deficit for Nov: -$80.2B vs. -$81.0B est
- Factory Orders for Nov: +1.6% vs. +1.5% est
- Average Hourly Earnings for Dec: +0.6% vs. +0.4% est
- Unemployment Rate for Dec: 3.9% vs. 4.1% est
On Target:
- Labor Force Participation Rate for Dec: 61.9% vs. 61.9% est
- Underemployment Rate for Dec: 7.3% vs. 7.3% last month
Worse (or lower) than expected:
- Construction Spending for Nov: +0.4% vs. +0.6% est
- ISM Manufacturing Index for Dec: 58.7 vs. 60.0 est
- JOLTS for Nov: 10.562M vs. 11.079M est
- Initial (weekly) Jobless Claims: 207k vs. 195k est
- ISM Services Index for Dec: 62.0 vs. 67.0 est
- Nonfarm Payrolls for Dec: +199k vs. +450k est
- Average Workweek for Dec: 34.7 vs. 34.8 est
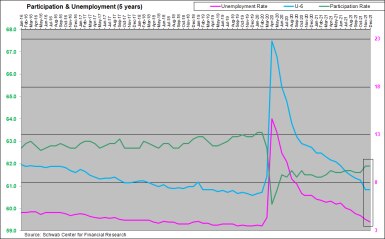
This was a busy week for economic data because it included the reports on the December employment situation. On the negative side, only 199k new jobs were created in December; well below the 450k estimate and below the 249k created in November; though October and November nonfarm payrolls were revised 141k higher. The Labor Force Participation Rate (green line), which has barely moved for the past 18 months, was unchanged at 61.9%.
On the positive side of things, the Unemployment Rate (pink line) fell to just 3.9%; a new post COVID low. That was better than the 4.1% estimate and better than the 4.2% in November. Additionally, while the (U-6) Underemployment Rate (blue line) was unchanged at 7.3%, the November rate was revised downward from 7.8% to just 7.3%, also a new post-COVID low.
Source: Schwab Center for Financial Research
Past performance is no guarantee of future results.
Market Performance YTD
Here is the 2022 YTD (versus 2021 full-year) performance of the market broken down by the 11 market sectors (as of the close on 1/6/22):
2022 YTD 2021 Final Category
- Energy +9.0% +47.7% Defensive
- Financials +4.2% +32.5% Cyclical
- Industrials +0.7% +19.4% Cyclical
- Cons Staples +0.2% +15.6% Defensive
- Consumer Disc -1.0% +23.7% Cyclical
- Materials -1.4% +25.0% Cyclical
- Utilities -2.4% +14.0% Defensive
- Communications Svc -2.4% +20.5% Defensive
- Info Tech -3.7% +33.4% Cyclical
- Healthcare -4.2% +24.2% Defensive
- Real Estate -4.4% +42.5% Cyclical
Source: Bloomberg L.P.
Past performance is no guarantee of future results.
Here is the 2022 YTD (versus 2021 full-year) performance of the major U.S. equity indices (as of the close on 1/6/22):
2022 YTD 2021 Final Forward P/E Ratio
- S&P 500 (SPX) -1.5% +26.9% 21.4
- Nasdaq Composite (COMPX) -3.6% +21.4% 30.6
- Dow Industrials (DJI) -0.3% +18.7% 19.2
- Russell 2000 (RUT) -1.7% +13.7% 24.7
Technicals
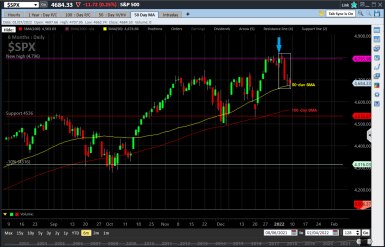
As I’m writing this (mid-day Friday 1/7) the SPX is down about 22 points (-0.5%) and is testing critical support at the 50-day SMA (currently 4,674). While the 50-day held up on Thursday (1/6), it’s too early to determine if it will hold again today. As you can see below, on the very first trading day of the year (Monday 1/3) the SPX closed at a new all-time high, and it has been sliding ever since.
With the SPX now down more than 2%, Monday’s record close (4,796) will be next week’s upside resistance level. As you can see in the chart below, if the SPX breaks down through the 50-day, there isn’t much support until the 100-day SMA (4,563) is reached. That would represent a -4.9% move from the top.
Source: StreetSmart Edge®
Past performance is no guarantee of future results.
Option Volumes:
At the end of 2021, December option volume averaged just 38.6M contracts per day. That was below the final November level of 45.2M, but above the December 2020 level of 34.4M contracts per day. After only a week, January is averaging 41.2M contracts per day. As a reminder, November’s 45.2M level set a new record as the busiest month of trading in the history of the options industry.
Open Interest:
OI Change:
The following data comes from the Chicago Board Options Exchange (Cboe) where about 98% of all index options, about 20% of all Exchange Traded Product (ETP) options, and about 15% of all equity options are traded:
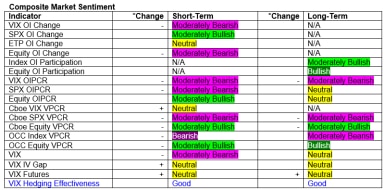
In reviewing the VIX OI Change for the past week I observed the following:
- VIX call OI was +7.4%
- VIX put OI was +3.5%
Historically, the daily change in the VIX and the SPX have been opposite each other about 80% of the time. These changes reflect a small bias toward the call side, so I see the VIX OI Change as moderately bearish for the market in the near-term.
In reviewing the SPX OI Change for the past week I observed the following:
- SPX call OI was +1.3%
- SPX put OI was +0.1%
While SPX volume tends to be mostly institutional hedging, these changes reflect a very small bias toward the call side, so I see the SPX OI Change as moderately bullish for the market in the near-term.
In reviewing the ETP OI change (which includes SPY, QQQ, DIA & IWM) for the past week I observed the following:
- ETP call OI was -0.5%
- ETP put OI was -0.5%
While the negative numbers are likely due to quarter-end options that expired on Friday (12/31), these changes reflect no bias toward the call or put side, so I see the ETP OI Change as neutral for the market in the near-term.
In reviewing the Equity OI Change for the past week I observed the following:
- Equity call OI was +2.0%
- Equity put OI was +2.6%
Equity volume tends to have a large retail component to it. These changes reflect an extremely small bias toward the put side, so I see the Equity OI Change as moderately bearish for the market in the near-term.
OI Participation
Index OI Participation is +8.5% versus 2021 levels, so I see it as moderately bullish in the long-term.
Equity/ETF OI Participation is +16.2% versus 2021 levels, so I see it as bullish in the long-term.
Open Interest Put/Call Ratios (OIPCR):
The VIX OIPCR is down 2 ticks to 0.55 versus 0.57 last week. This ratio tends to move in the same direction as the VIX index, so this move is inconsistent with the VIX, which was +2.39 (+13.9%) over the last 4 sessions. This downtick probably implies that participants may be expecting the VIX to continue to trend higher over the next few days. As a result, I see the VIX OIPCR as moderately bearish in the very near-term for the markets. This ratio is now down 25 ticks in the last 4 weeks and is also well below the 200-day SMA of 0.64. As a result, I see it as moderately bearish in the long-term for the markets.
The SPX OIPCR is up 2 ticks to 2.20 versus 2.18 last week. This ratio also tends to move in the same direction as the SPX, so this uptick is also inconsistent with the SPX, which has fallen 70.13 points (-1.5%) over the last 4 sessions. As a result, it likely indicates that SPX option traders (who are almost entirely institutional) may be expecting a little more downside in the SPX next week. Therefore, I see the SPX OIPCR as moderately bearish in the near-term for the market. This ratio is now 22 ticks below its mid-September high and just below the 200-day SMA of 2.21. I see it as neutral in the long-term.
The normally very stable Equity OIPCR is unchanged again at 0.78 versus 0.78 last week. This ratio is now 2 ticks above its lowest level since mid-July. At this level it implies that equity option traders (which includes a lot of retail traders) remain about as bullish as last week, though less bullish than in Q1. I see the Equity OIPCR as moderately bullish in the near-term for the market. This ratio remains very close to the 200-day SMA (currently 0.77), so I see it as neutral in the long-term.
Cboe Volume Put/Call Ratios (VPCR):
The Cboe VIX VPCR has moved from neutral to moderately bullish this week. The 0.90 reading on Thursday (1/6) was moderately bullish but the current reading of 0.56 as I’m writing this (mid-day Friday 1/7) is neutral. Since this ratio tends to decline as the day goes on, I see it as neutral in the very near-term.
The Cboe SPX VPCR has been moderately bearish this week. The 1.75 reading on Thursday (1/6) was moderately bearish, and the current reading of 1.86 as I’m writing this (mid-day Friday 1/7) is moderately bearish. While intraday levels tend to decline as the day goes on, I see it as moderately bearish in the very near-term. With a 5-day moving average of 1.83 versus 1.56 last week, I see it as moderately bearish in the long-term too.
The Cboe Equity VPCR has been moderately bullish (<0.63) this week. The 0.60 reading on Thursday (1/6) was moderately bullish, but the current reading of 0.71 as I’m writing this is neutral. Since this ratio tends to decline as the day goes on, I see it as moderately bullish in the very near-term. With a 5-day moving average of 0.52 versus 0.50 last week, I see it as moderately bullish in the long-term too. As noted below, long-term for this ratio is about a week or two.
Since volume based put/call ratios are very reactive and very short-term in nature, near-term usually means just a day or two, while long-term is more like a week or two.
OCC Volume Put/Call Ratios (VPCR):
The OCC Index VPCR has been bearish (>1.40) all week. As a result, I see it as bearish in the near-term. It has been moderately bearish in 10 of the last 15 sessions, so I see it as still moderately bearish in the long-term.
The OCC Equity VPCR has moved from bullish (<0.63) to moderately bullish (<0.80) this week. Therefore, I see it as moderately bullish in the near-term. With a 5-day average of 0.62 versus 0.59 last week, it remains bullish in the long-term.
Volatility:
Cboe Volatility Index (VIX)
At the time of this writing (mid-day Friday 1/7), the VIX is +0.08 to 19.69. At its current level, the VIX is implying intraday moves in the SPX of about 48 points per day (this was 44 last week). The 20-day historical volatility is 122% this week versus 198% last week. The VIX is near its long-term average (19.54) but well above its long-term mode (12.42) which I consider to be “normal” volatility. At this level I see the VIX as moderately bearish in the very near-term for the equity markets. While the VIX is 16 points below its December intraday high, it is well above its 12-month low, which occurred about 8 weeks ago. I see it as neutral in the long-term for now.
On a week-over-week basis, VIX call prices have fallen while VIX put prices have risen. At +95 versus +169 last week, the VIX IV Gap (the average IV of VIX calls less the average IV of VIX puts) is much lower. At this level it is neutral in the very near-term. The VIX IV Gap has been surprisingly stabile over the past 4 weeks, so I see it as neutral in the long-term.
Keep in mind, this is not only a contrarian indicator most of the time, it tends to be one of the earliest and shortest-term indicators I discuss in this report, so it can also change directions very quickly.
VIX Futures
As of this writing (mid-day Friday 1/7) the nearest VIX futures contract (which expires on 1/12) was trading at 20.50; less than a point above the spot VIX level of 19.69. Adjusting this price for the risk premium factor (which takes into account the time until expiration), the Risk Premium Adjusted Price (RPAP) is 20.11; less than a half point above the spot price.
With an adjusted level that is fairly close to the spot price, futures traders are indicating that they believe the VIX is likely to tick up a bit over the next few days. Therefore, I see VIX futures as neutral in the near-term for the market. The RPAPs of the next two closest monthly futures contracts are 20.03 and 20.53 respectively. With the RPAPs of the further-dated contracts both less than a point above the spot price, I see VIX futures as neutral in the long-term for the SPX.
Since VIX futures are typically much less reactive to current market conditions than the VIX index, near-term for VIX futures usually means a few days, while long-term means a couple of weeks.
With the VIX up more than 2 points this week, VIX Hedging Effectiveness has risen to Good in the near-term. At the moment, this means that options on the VIX (and possibly other volatility-related products) are showing fairly good sensitivity to market volatility, and maybe somewhat effective as hedging tools in the very near-term. VIX Hedging Effectiveness remains Good in the long-term.
VIX Hedging Effectiveness is a manner of measuring the magnitude of VIX moves relative to the magnitude of SPX moves in the opposite direction. When the VIX is highly reactive, VIX related products can serve as potentially effective hedging tools, when the VIX is not very reactive, traditional hedging techniques may be a better choice.
Global News:
Cryptocurrencies
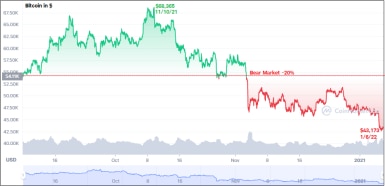
I don’t usually show cryptocurrency charts in this section, but the bear market in some of the majors has been quite dramatic. Ethereum (ETH) is -29%, Binance Coin (BNB) is -28%, Solana (SOL) is -41%, and as shown below, Bitcoin (BTC), which fell into a bear market (down >20%) back in early December, has continued to decline and is now -38% from its early November high. For those investors who worry that a sharp decline in cryptocurrencies could spill over into traditional equities, the SPX is +1.1% during that same period of time.
Source: CoinMarketCap.com
Past performance is no guarantee of future results.
For Schwab’s perspective on cryptocurrencies, please visit: www.schwab.com/cryptocurrency
Economic reports for next week:
Mon 1/10
Wholesale Inventories for Nov – This report covers manufacturing inventory data, so it is not a good indicator of consumer activity, but it may have ramifications on future GDP levels.
Tue 1/11
None
Wed 1/12
CPI for Dec – The Consumer Price Index measures the change in the average price level (inflation or deflation) of a fixed basket of goods and services, relative to the price levels from the base year of 1984.
Treasury Budget for Dec - The monthly treasury budget measures year to year changes in tax receipts and outlays. Since most taxes are collected in April, the market usually does not react much to this report during the other 11 months of the year.
Thu 1/13
Initial Jobless Claims - For the week ending 1/1/22, claims were up 7k after being down 6k the prior week. The 4-week moving average now stands at 205k, unchanged from the prior week.
PPI for Dec – The Producer Price Index measures inflation at the wholesale or manufacturing level.
Fri 1/14
Retail Sales for Dec – This report is a widely watched gauge of consumer sentiment and spending habits.
International Trade (Import & Export Prices) for Dec – This report tracks the prices of goods bought in the US but produced abroad and the prices of goods sold abroad but produced in the US, respectively. Price changes are impacted by inflationary pressures and currency exchange rates.
Industrial Production & Capacity Utilization for Dec – Industrial production measures industrial output as a percentage, relative to output from 2007. Capacity Utilization measures output potential as a percentage, relative to the actual output from 2007.
Business Inventories for Nov – This is a lagging indicator since all of the components have been previously released.
University of Michigan Consumer Sentiment for Jan – This is the Preliminary (first) report for January. The final report for December improved to 70.6 from 67.4 previously.
Interest Rates:
The Fed Funds Futures probability of an interest rate hike in March has risen to 86% from 68% only a week ago.
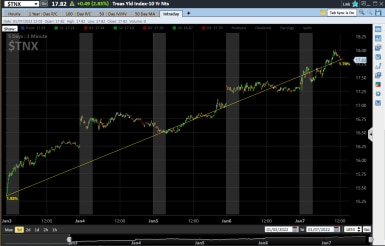
The release of the minutes of the December 15th FOMC meeting on Wednesday (1/5) somehow surprised market participants, sparking the sharpest single-day decline in the SPX since 12/7/21. As you can see below, the resulting move in interest rates on the 10-year treasury ($TNX) has been even more remarkable; from 1.53% to 1.78% at the time of this writing (mid-day Friday 1/7). If this keeps up, TINA (There Is No Alternative) will be replaced by TIAA (There Is An Alternative).
Source: StreetSmart Edge®
Past performance is no guarantee of future results.
Outlook:
Fed Chair Powell turned hawkish back on 11/30, but caution in the equity markets didn’t really arrive until the new year began. The indicators point to more volatility and potentially more downside for next week.
Bottom Line:
Last week’s Moderately Bullish outlook was right on the money during the first half of the week, but then the FOMC released the minutes of their December meeting on Wednesday afternoon, and it was all downhill from there. It is still puzzling to me how so many participants were seemingly caught off guard by its hawkish tone. Fed Chair Jay Powell’s hawkish pivot happened way back on November 30th, sparking a -3% downturn in the SPX, and he has never wavered from that stance since; yet somehow equity markets didn’t believe it until this week.
As you can see below, there were several more downgrades than upgrades this week, and that puts the balance of the indicators solidly in the Moderately Bearish zone for the second week of 2022. Additionally, since the VIX has risen and the indicators point to further rises, next week is also likely to be more Volatile.
Past performance is no guarantee of future results.
Key:
OI = Open Interest
OIPCR = Open Interest Put/Call Ratio
VPCR = Volume Put/Call Ratio
IV = Implied Volatility
+ means this indicator has changed in a bullish direction from the prior posting.
– means this indicator has changed in a bearish direction from the prior posting.
+/ – means this indicator has changed bi-directionally; i.e. last week was either Volatile, N/A or Breakout.
^ means this indicator is at a historical extreme that has often (though not always) preceded a market reversal.
 By
By
